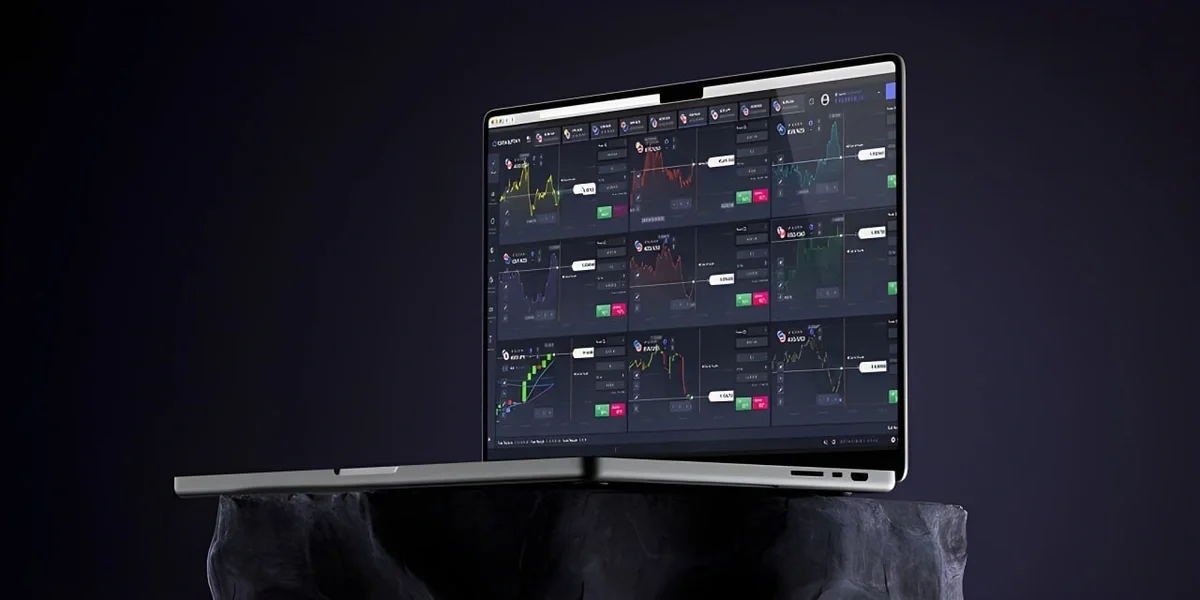
"Successful trading begins with accurate data analysis, not intuition."
In the rapidly evolving financial markets, charts are more than just a record of prices—they are the ultimate roadmap for deciphering market psychology and future trends. BABA Option provides sophisticated and powerful technical analysis tools designed to ensure traders never miss even the most subtle market movements. This guide explores in detail how everyone from beginners to experts can fully leverage BABA Option’s charting features to make more objective and strategic investment decisions.
"Optimizing Trading Efficiency: Selecting the Right Chart Interface for Your Strategy"
At BABA Option, we recognize that every trader possesses a unique analytical style and execution strategy. To go beyond simple price visualization, we provide a diverse range of charting formats designed to maximize user convenience and streamline the decision-making process.
Whether you are a long-term investor needing to identify macro trends at a glance or a scalper capturing split-second entry points, BABA Option empowers you to choose the chart type that best fits your environment. By aligning your tools with your strategy, you can enhance both your analytical depth and your overall order efficiency.
Step 1.

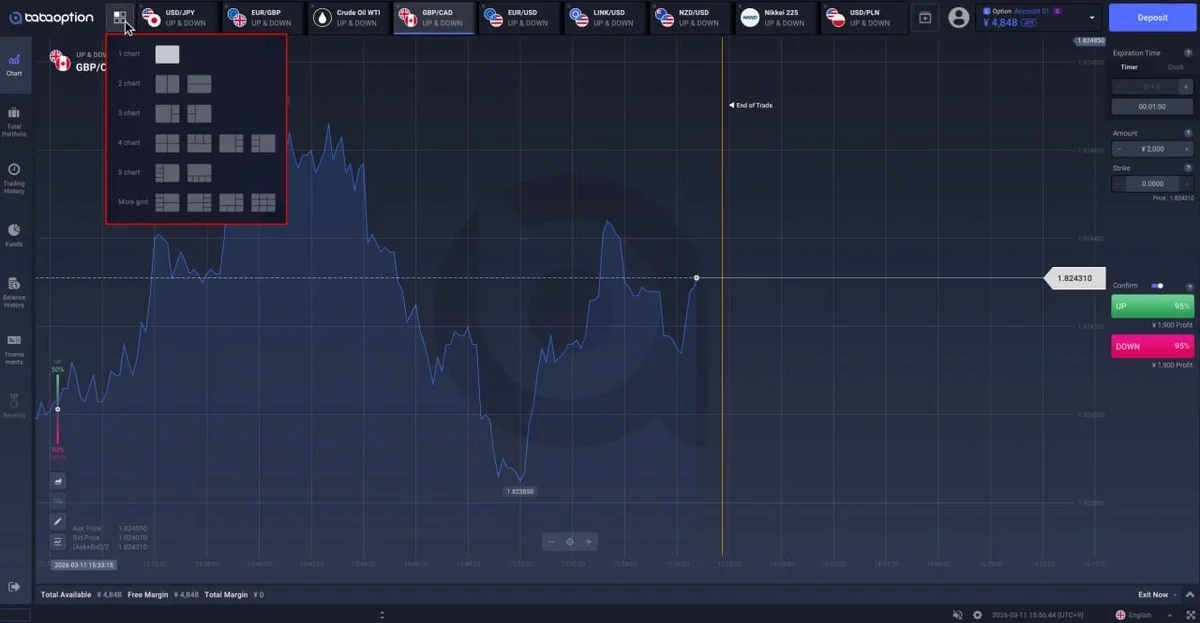
Access the Multi-Layout Menu Click the 'Layout Settings (Grid Icon)' button located in the top-left corner of the platform. This serves as your control center for managing the trading interface.
Step 2.

Select a Screen Split Format Based on Your Strategy Upon clicking, a variety of chart formats tailored to different analytical styles will be displayed. This allows you to:

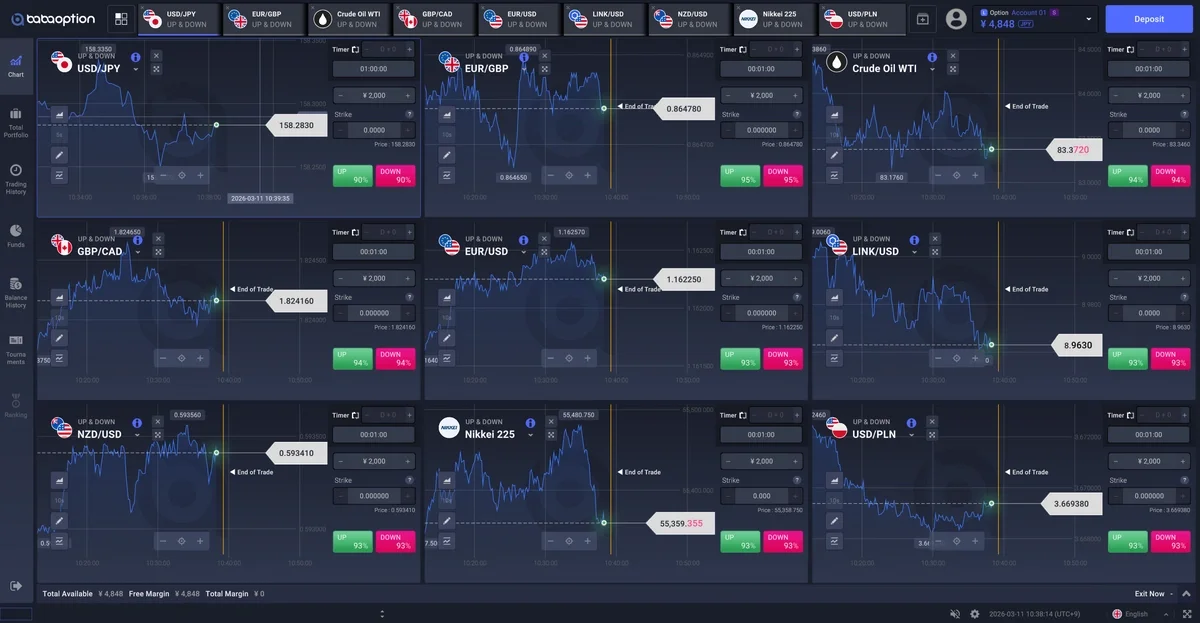
 - Correlation Analysis: Compare the synchronization of multiple assets (e.g., BTC and ETH) in real-time.

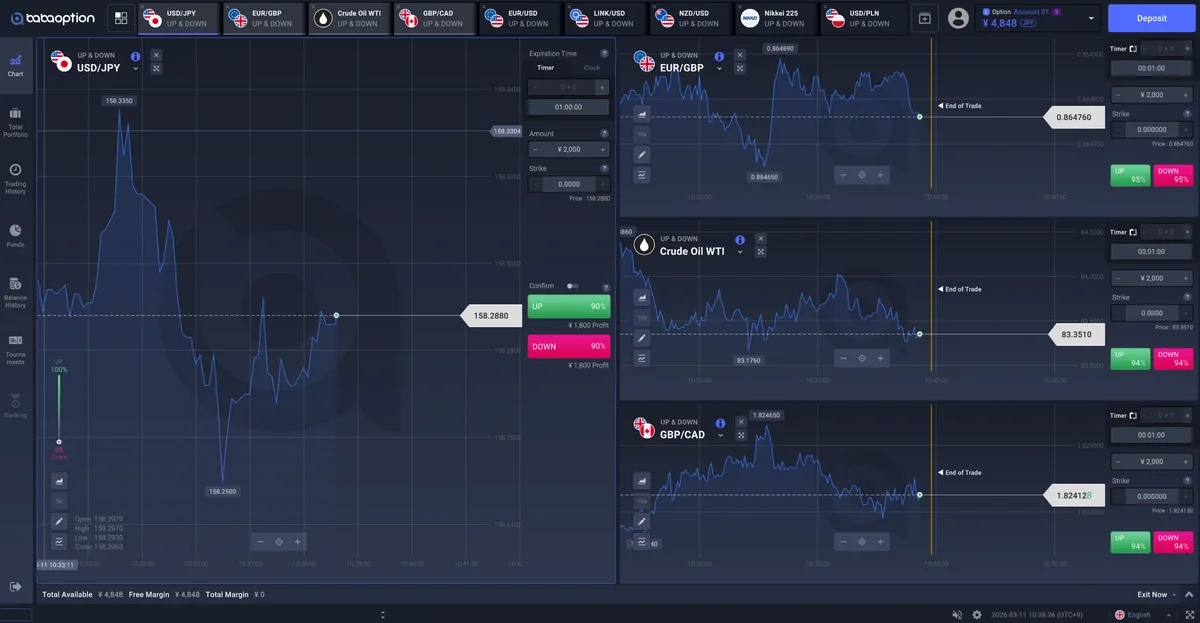
 - Multi-Timeframe Analysis: Display the same asset across different timeframes—such as Minute, Hour, and Day—to analyze macro trends and precise entry points simultaneously on a single screen.
Step 3.

Build Your Personalized Analytical Environment Choose the chart format that best aligns with your specific trading strategy. The screen configuration will transition immediately, allowing you to set individual indicators for each chart and complete your own customized analytical dashboard.
The image below shows the interface as it appears in practice.
"Selecting the Optimal Chart Type to Enhance Strategic Clarity"
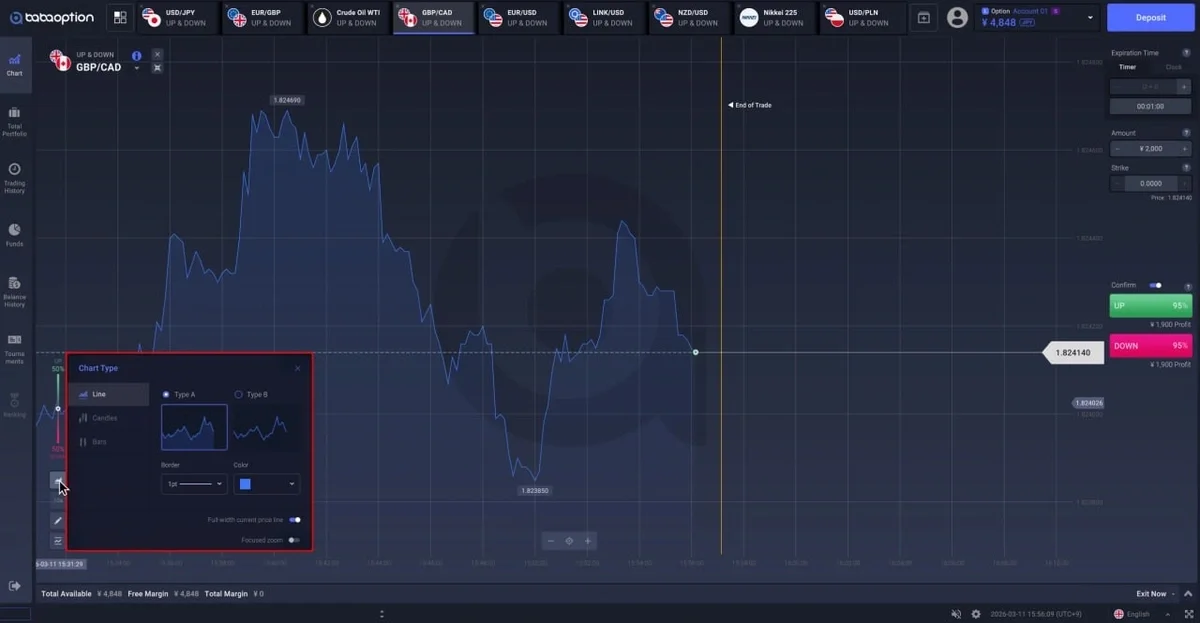
The precision of your analysis is often determined by subtle visual differences. To help traders absorb market data as efficiently as possible, BABA Option supports three core chart types: Line, Candlestick, and Bar. By understanding the unique characteristics of each and aligning them with your personal trading style, you can minimize judgmental errors and maximize the efficiency of your order execution.
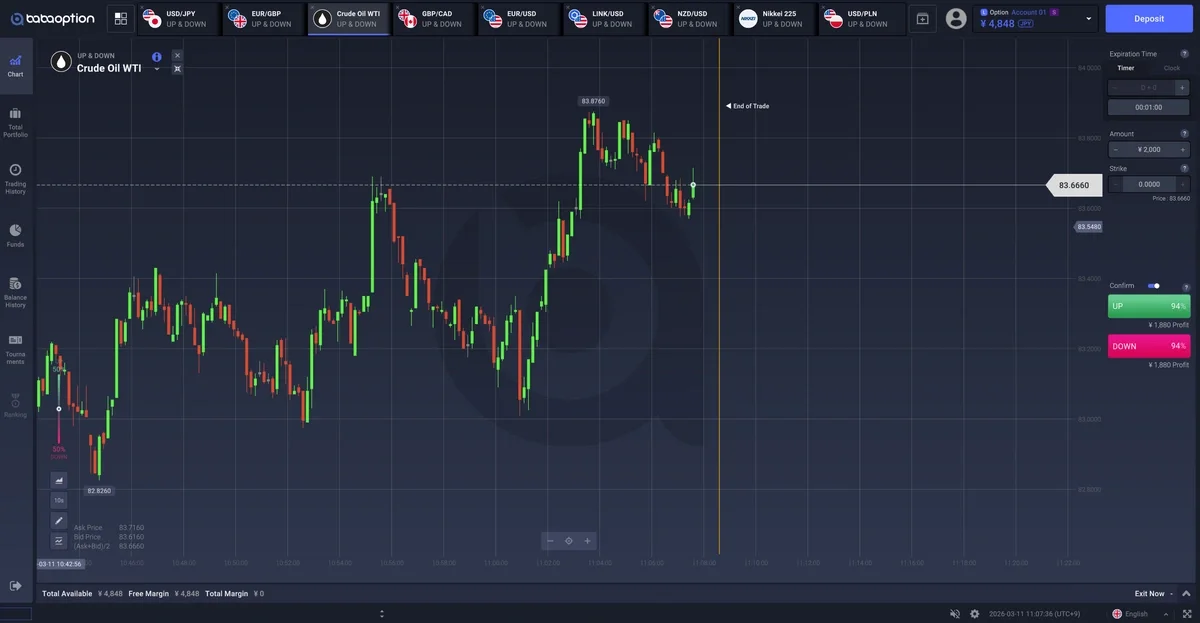
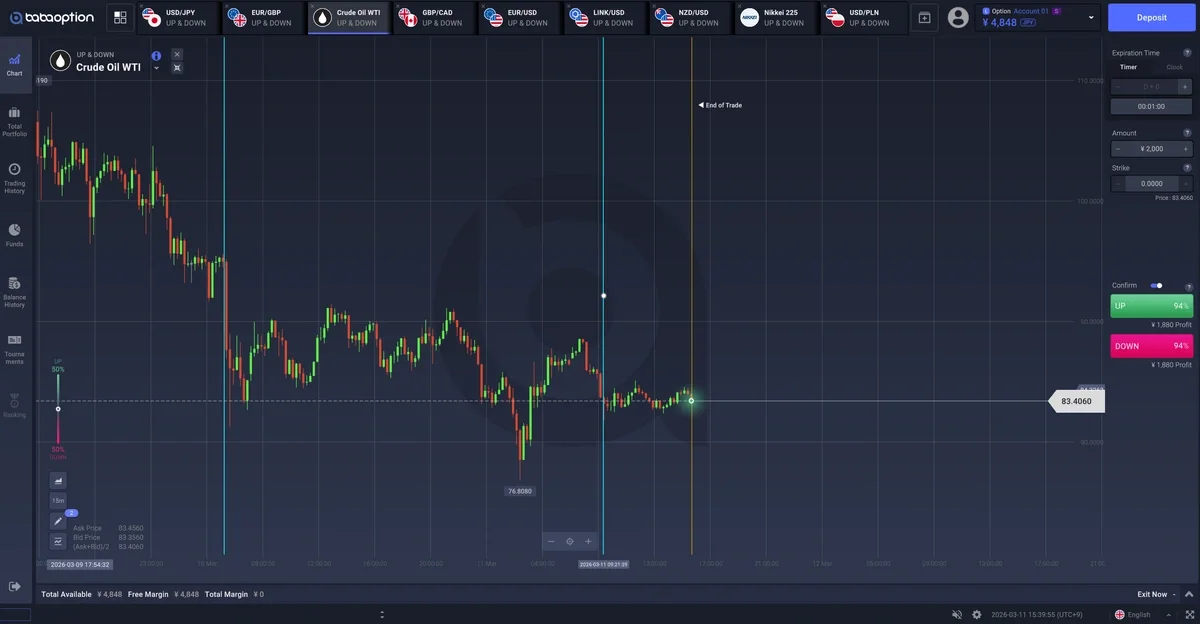
This chart provides a smooth visualization of the overall market flow. It is the optimal choice when you want to filter out complex noise and identify the macro direction of the market at a single glance.
The most popular and powerful tool in trading. By visualizing the Open, Close, High, and Low prices within a specific period, it allows you to precisely read the balance of power between buyers and sellers. This type is essential for identifying reversal points through pattern analysis.
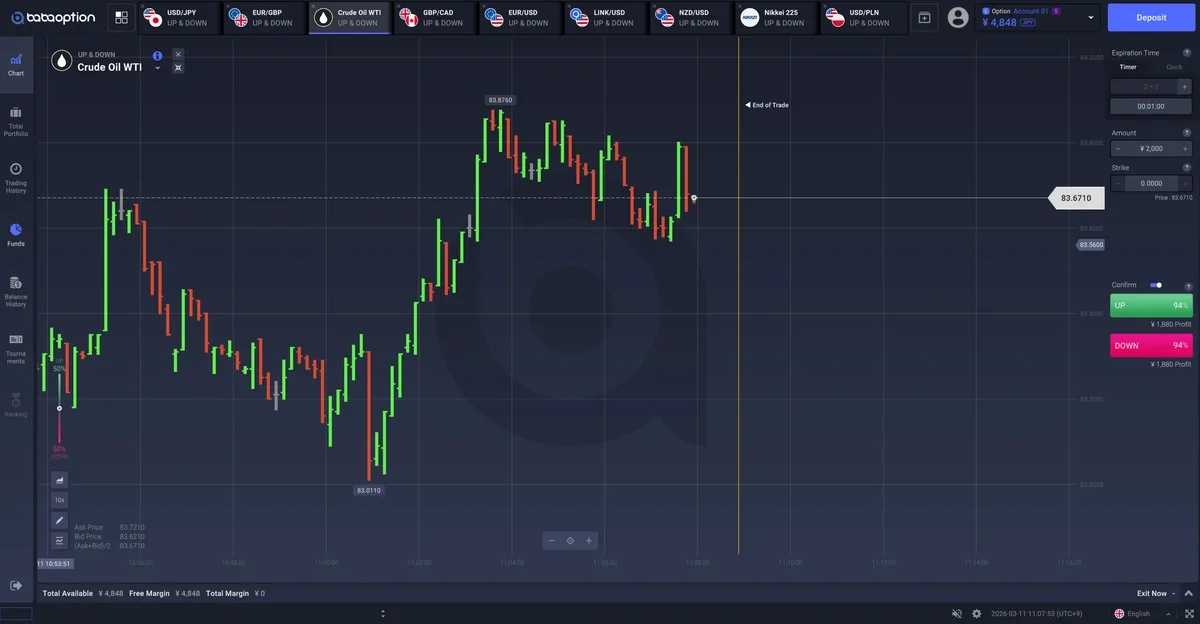
The Bar chart provides similar information to the Candlestick chart while maintaining visual simplicity. Favored by many Western professional traders, this format prevents the chart from becoming overly cluttered when overlaying multiple indicators, allowing you to focus purely on price volatility.
The image below shows the interface as it appears in practice.
"Mastering Market Rhythm: Selecting the Optimal Time Interval for Your Strategy"
In trading, time is just as critical a variable as price. BABA Option supports a wide range of Time Interval settings, enabling everything from high-speed, second-by-second execution to macro-level daily analysis. Selecting the right interval for your analytical goals is the first step toward filtering out market 'noise' and capturing accurate signals.
Ideal for scalpers and day traders. Short intervals—such as tick or minute-based charts—allow you to capture immediate market reactions and micro-price movements in real-time. This is essential for high-frequency trading where entry and exit decisions happen in a split second.
Recommended for swing traders and long-term investors. Hourly or daily charts filter out minor price fluctuations (whipsaws) and clearly reveal the true direction of the market. These intervals provide the highest reliability when analyzing key support/resistance levels and major trendlines.
Successful traders rarely rely on a single interval. They add dimension to their analysis by confirming overall trends on a daily chart while identifying precise entry points on a minute chart. By utilizing BABA Option’s multi-layout feature, you can seamlessly perform this complex analysis on a single screen.
"Mapping Your Success: A Guide to BABA Option Drawing Tools"
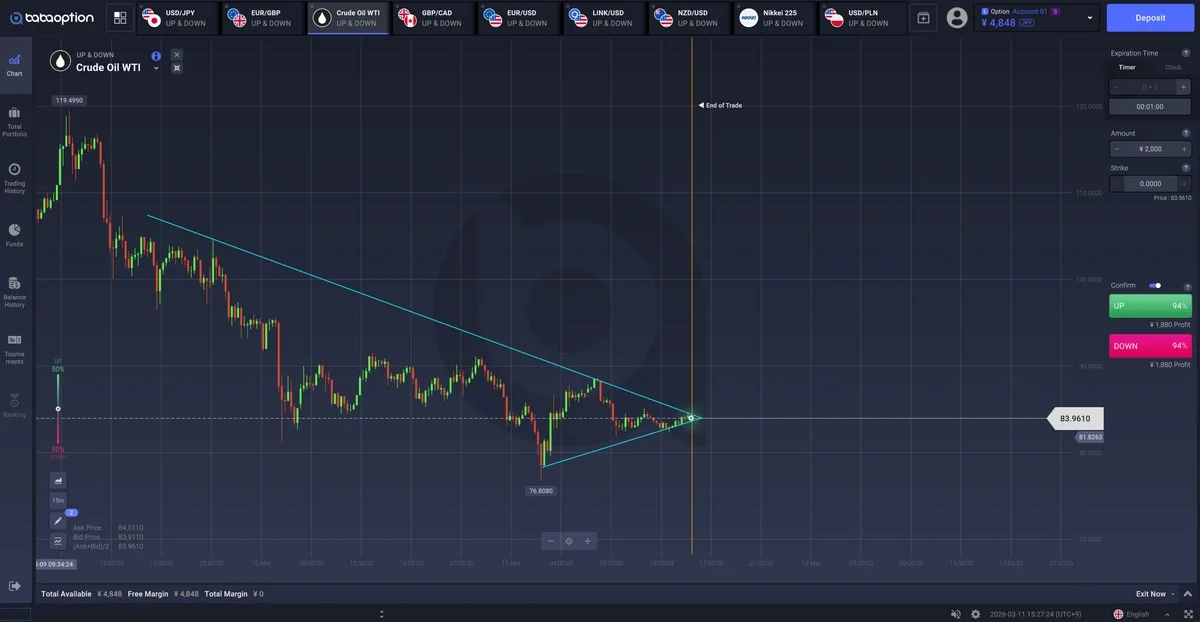
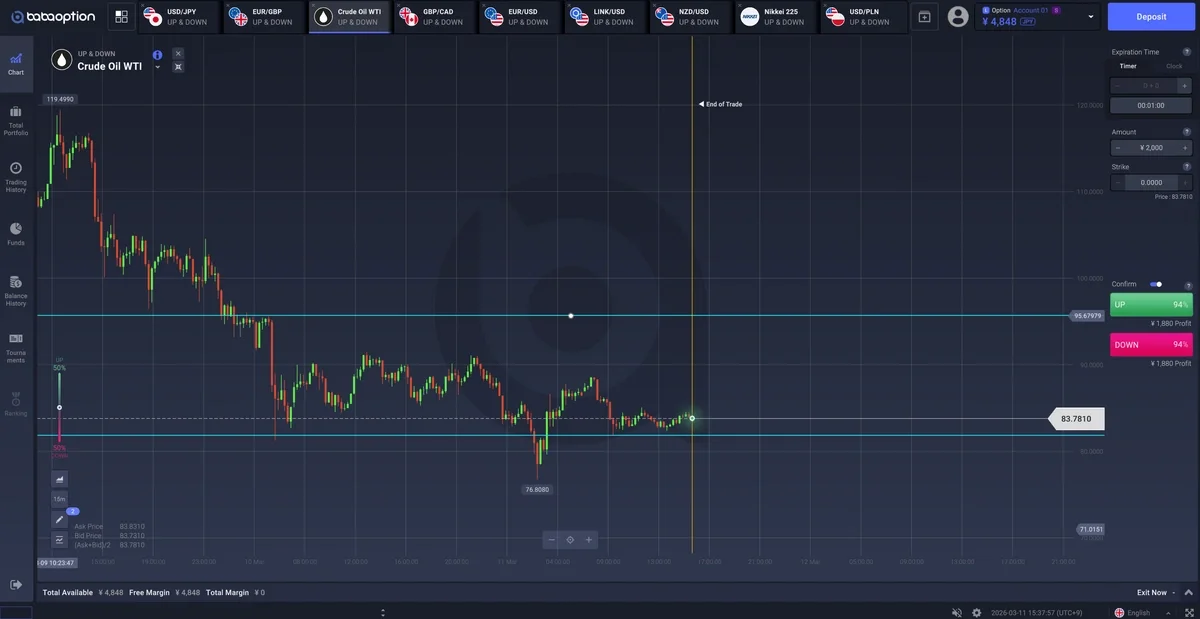
Beyond technical indicators, the ability to visualize market structures directly on a chart is what separates professional traders. BABA Option offers a sophisticated set of Drawing Tools that allow you to map out market dynamics and anticipate potential reversal points. Discover how a simple line can become a powerful trading standard.
By connecting a series of lows or highs, trend lines visualize the dominant direction of the market. They serve as more than mere lines; they are critical support and resistance tools used to identify where prices may bounce or breakout.
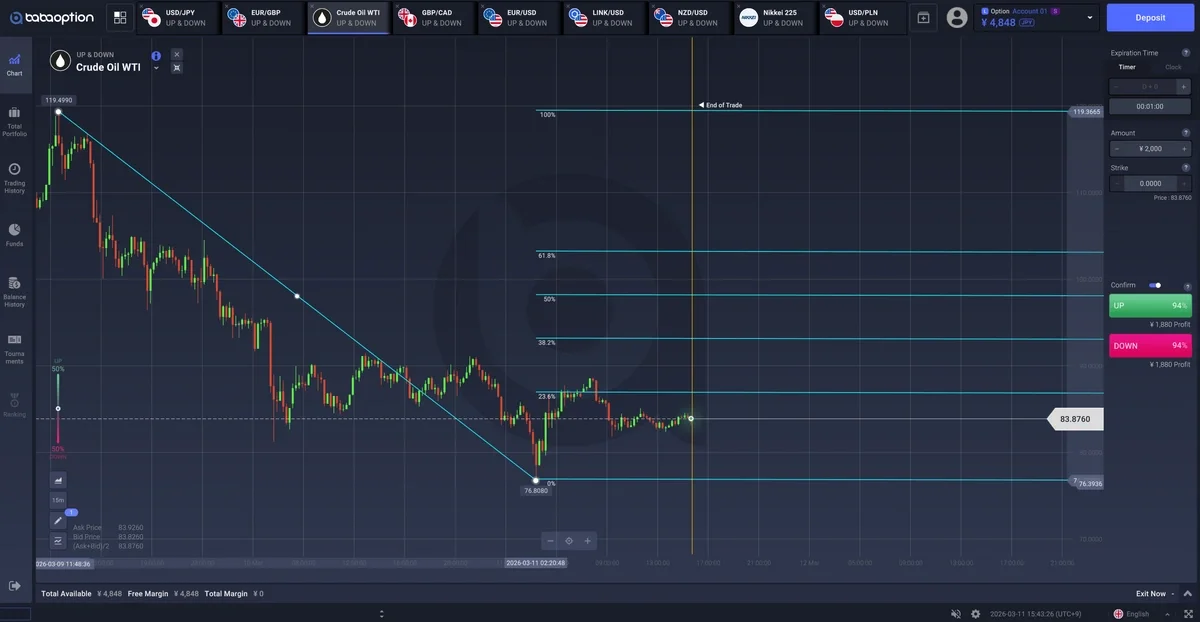
Based on golden ratios, this tool predicts the depth of temporary pullbacks during an uptrend or downtrend. Key levels—such as 23.6%, 38.2%, and 61.8%—are watched by traders worldwide as potential bounce zones, making them highly effective for identifying precise entry points.
"Precision Trading Signals: 10 Essential Technical Indicators on BABA Option"
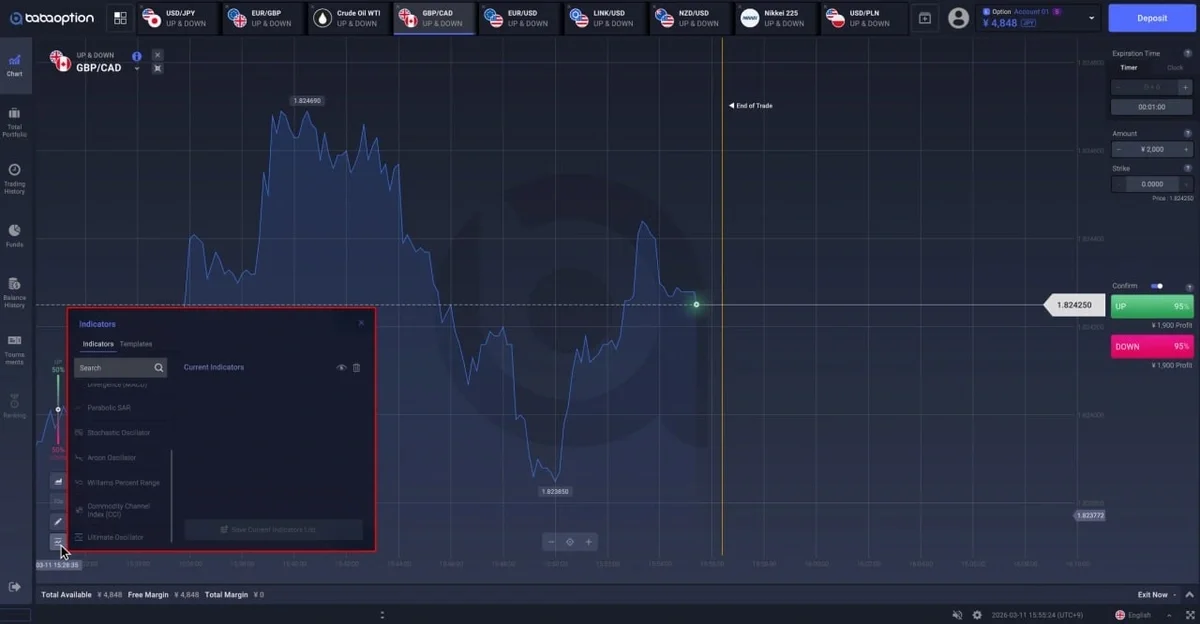
The completion of technical analysis lies in uncovering the 'statistical evidence' hidden within price movements. BABA Option supports 10 meticulously selected core indicators, enabling traders to multidimensionally analyze market trends, volatility, and overbought/oversold conditions. Leverage BABA Option’s powerful analytical tools to build your optimal trading environment.
A line connecting the average prices over a specific period, reflecting the "average sentiment" of the market.
Detailed Insight: The most common types are the SMA (Simple Moving Average), which is a basic arithmetic mean, and the EMA (Exponential Moving Average), which gives more weight to recent prices. A 'Golden Cross' (short-term MA crossing above long-term MA) is a buy signal, while a 'Death Cross' (crossing below) is a sell signal.

Summary: Identifies trend direction and support/resistance levels through average price flows.
This indicator is based on the principle that price typically moves within a specific range of standard deviations around a moving average.
Detailed Insight: It consists of a midline (usually a 20-day MA) and upper/lower bands. A 'Squeeze' (when bands narrow) often precedes a period of high volatility. If the price "rides" the upper band, it indicates a strong upward trend.

Summary: Visualizes volatility ranges to capture breakout and mean-reversion points.
Measures the speed and change of price movements to identify the relative strength of buying vs. selling pressure.
Detailed Insight: The value ranges from 0 to 100. Generally, a reading above 70 is considered overbought, and below 30 is considered oversold. A 'Divergence'—where the price hits a new high but the RSI does not—is a powerful signal of an impending trend reversal.

Summary: Diagnoses overbought or oversold conditions by measuring the relative strength of price momentum.
A trend-following momentum indicator that shows the relationship between two moving averages of a security’s price.
Detailed Insight: It consists of the MACD line (difference between short-term and long-term EMAs) and a Signal line. When the MACD line crosses above the zero line, it signals an uptrend. The changing height of the histogram bars helps traders read the acceleration of the trend.

Summary: Reads trend reversal signals through the convergence and divergence of short- and long-term moving averages.
Standing for "Stop and Reverse," this indicator is designed to find potential reversals in the market price direction.
Detailed Insight: It appears as a series of dots placed either above or below the price. Dots below the price indicate a bullish trend, while dots above indicate a bearish trend. The moment the dots flip position is considered a primary entry or exit signal.

Summary: Intuitively presents entry and exit timings by marking trend continuation and stopping points.
Compares a specific closing price of a security to a range of its prices over a certain period of time.
Detailed Insight: Signals are generated when the %K line crosses the %D line. While similar to RSI, it is much more sensitive, making it highly effective for identifying buy and sell points in sideways or range-bound markets.

Summary: Identifies short-term bounce points by representing the current price position as a percentage of its range.
Calculates the time it takes for the price to reach the highest and lowest points within a specific timeframe.
Detailed Insight: It calculates the difference between 'Aroon Up' and 'Aroon Down.' A value above 0 indicates a strong bullish trend, while a value below 0 suggests bearish dominance. It is excellent for catching the very beginning of a new trend.

Summary: Measures the strength of an existing trend and the moment a new one forms.
A momentum indicator that measures overbought and oversold levels, similar to the Stochastic Oscillator but plotted on an inverted scale.
Detailed Insight: It reflects the level of the close relative to the highest high for the look-back period. Values range from 0 to -100. Readings above -20 are overbought, and below -80 are oversold. Its high sensitivity makes it great for catching "peaks" before a trend shifts.

Summary: A highly sensitive momentum indicator for capturing extreme overbought and oversold levels.
Measures the current price level relative to an average price level over a given period of time.
Detailed Insight: Originally developed for commodities, it is now used widely across all markets. A move above +100 signals the start of a strong uptrend, while a move below -100 signals the start of a strong downtrend.

Summary: Analyzes the beginning and end of a trend by calculating how far the price has deviated from its average.
Developed to address the flaws of other oscillators that use only a single timeframe, this indicator uses a weighted average of three different periods.
Detailed Insight: By combining short, medium, and long-term cycles (usually 7, 14, and 28 days), it filters out "fake signals" (noise). It is used to identify more reliable and stable trend reversals that single-period indicators might miss.

Summary: Combines three different timeframes to provide reliable momentum data, filtering out short-term noise.
"Stop Repetitive Setup: Maximize Trading Efficiency with BABA Option Templates "
In trading, speed and precision are everything. Are you still manually readjusting your indicators every time you switch assets or change order types?
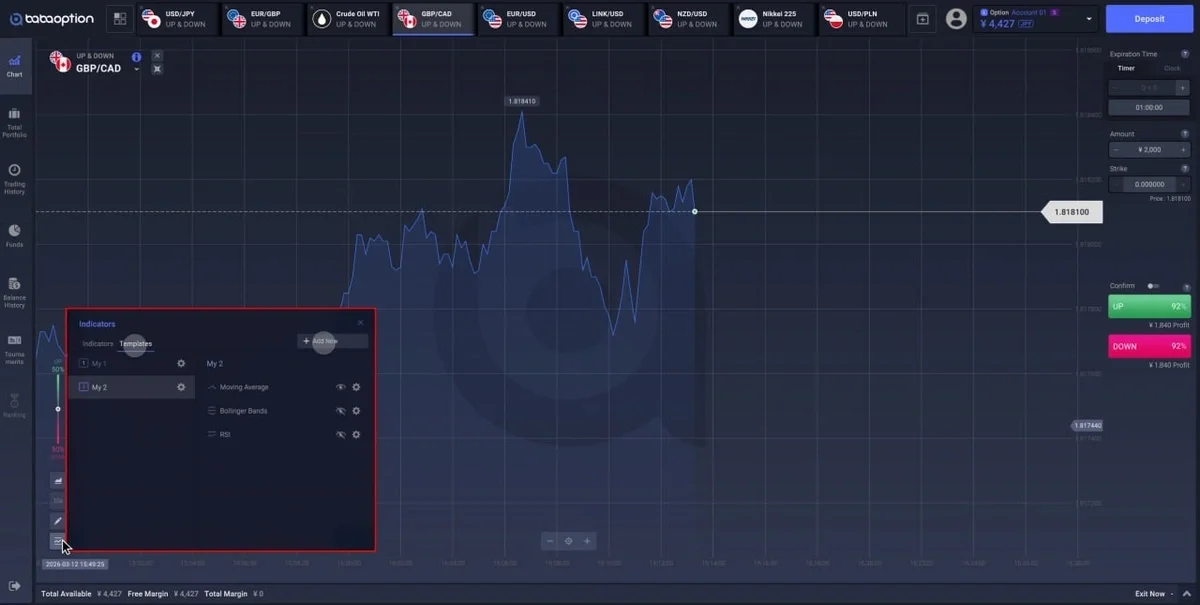
With the BABA Option Template feature, you can recall your optimized analysis environment with just a single click. Whether you change underlying assets or shift your trading strategy, your personalized settings are applied instantly. By eliminating unnecessary setup time, you can focus entirely on what matters most—your profit. Build your perfect trading environment today and stay ahead of the market.
We have explored how to effectively use the smart chart tools of BABA Option.
We sincerely hope the information shared today provides practical value to your successful investment journey. To ensure our customers have the most optimized trading opportunities, we will continue to innovate and return with even better services.
We wish you a day filled with successful trades.
Thank you.