Complete Guide to the Binary Options Fibonacci Scaling Strategy

A progressive money management strategy that gradually increases investment amounts after wins using the Fibonacci sequence.
1. What Is the Fibonacci Scaling Strategy?
2. Why Use Scaling After a Win?
3. Fibonacci Sequence and Investment Flow
4. Example: One Loss After 4 Consecutive Wins (95% Payout Rate)
5. Comparison: One Loss After 3, 4, and 5 Consecutive Wins
6. How Is It Different from the Paroli Strategy?
7. Situations Where the Fibonacci Strategy Is Attractive
8. Practical Application Guidelines
9. Real Trading Scenario: When Paroli Feels Too Risky
10. Understanding Fibonacci from a Profit Protection Perspective
11. Recommended Operating Summary
12. How to Verify the Strategy: Remaining Profit After the Final Loss
13. Key Points to Emphasize in Content
14. Fibonacci Scaling Strategy Complete Guide Demo Test Routine
15. Conditions to Check Before Applying the Fibonacci Scaling Strategy
16. Final Recommended Position
17. Frequently Asked Questions
18. Risk Disclosure
The Fibonacci scaling strategy is a method of increasing investment amounts after wins, but unlike the Paroli strategy, it does not double the position size aggressively. Instead, it uses the Fibonacci sequence — such as 1, 1, 2, 3, 5, 8 — where each number is created by adding the two previous numbers, allowing investment growth to increase at a more gradual pace.
The key advantage of this strategy is that it can grow profits during winning streaks while maintaining a structure where a single final loss does not wipe out all previous gains. For example, with a 95% payout rate, even after four consecutive wins followed by one loss, cumulative profit can still remain positive. This is one of the strongest points when explaining the Fibonacci strategy.
In this guide, we will cover the core structure of the Fibonacci scaling strategy, the sequence flow, real examples based on a 95% payout rate, comparisons with the Paroli strategy, scenarios involving one loss after multiple wins, and the types of traders best suited for this approach — all organized in a complete SEO-friendly format.
Investment amounts are increased step by step after wins using the Fibonacci sequence.
Compared to the Paroli strategy, the growth pace is more gradual, which can reduce the psychological burden of the final stage.
In a 95% payout example, even after 4 consecutive wins followed by 1 loss, a cumulative profit of +1,650 remains.
After a loss, the strategy typically resets to the base amount and starts a new cycle.
The core objective is to maximize winning streaks while controlling the amount of profit given back.
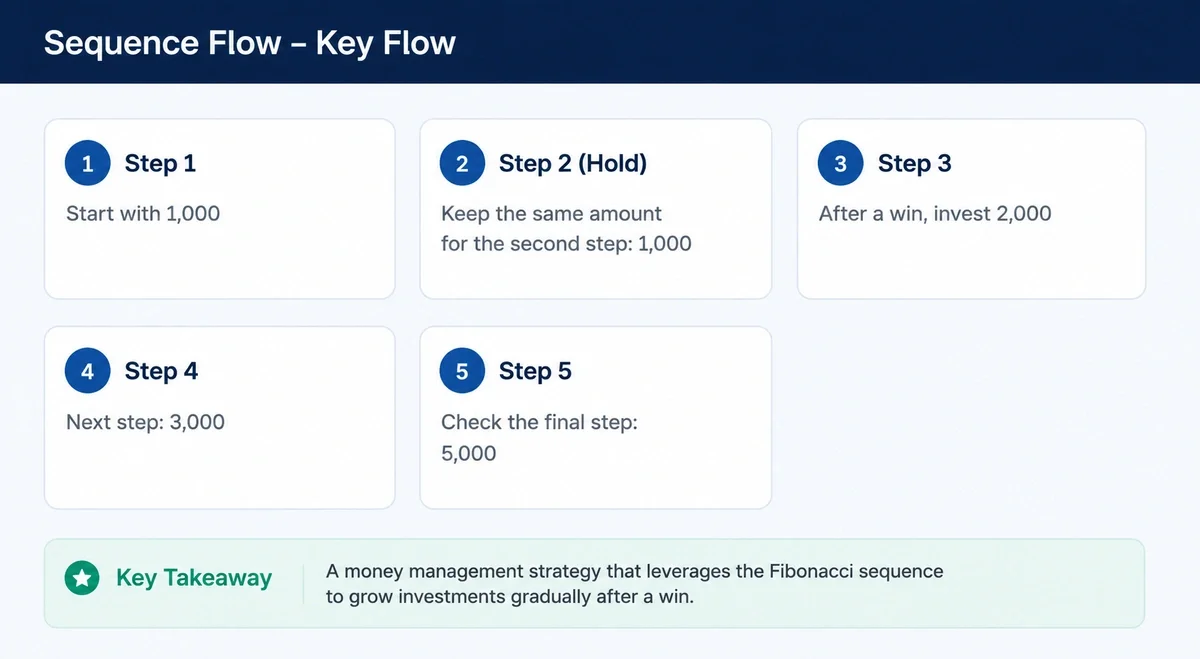
The Fibonacci scaling strategy is a money management method that increases investment amounts after wins according to the Fibonacci sequence. If the base amount is 1,000, the investment flow may progress like this:
1,000 → 1,000 → 2,000 → 3,000 → 5,000 → 8,000
Unlike the Paroli strategy, which grows rapidly such as 1,000 → 2,000 → 4,000, the Fibonacci strategy keeps the same amount once more in the early stage and then increases more gradually overall. Because of this difference, the Fibonacci strategy is often introduced as a smoother alternative among win-based scaling strategies.
In most cases, when a loss occurs, the cycle resets back to the base amount. In other words, the strategy is designed to take advantage of winning streaks, but once the streak ends, a new cycle begins. In this sense, it is similar to the Paroli strategy, although the scaling speed is much more moderate.
The Fibonacci strategy is not a loss-chasing system. Instead, it only moves to the next sequence after a profit is made. Because of this, users often feel that they are “using part of the profit already earned to move to the next stage.” This can feel psychologically more comfortable than strategies that increase positions after losses.
In binary options trading, winning streaks can occur within a short period of time. With a fixed-amount trading approach, profits accumulate at a constant pace, while the Fibonacci strategy gradually increases investment amounts as the winning streak continues, allowing profits to scale progressively. However, compared to the Paroli strategy, the growth speed is slower, which means the pressure at the final stage is relatively lower.
This strategy is often more appealing to users who want to take advantage of winning streaks without aggressively increasing position sizes. It is particularly effective when presented after explaining the Paroli strategy, as it naturally connects as a “softer post-win scaling approach.”
The Fibonacci sequence follows a structure where each new number is created by adding the two previous numbers, such as:
1, 1, 2, 3, 5, 8, 13...
When applied to investment amounts, each sequence value is multiplied by the base amount. For example, with a base amount of 1,000, the flow becomes:
1,000 → 1,000 → 2,000 → 3,000 → 5,000
One advantage of this structure is that the increase in position size remains intuitive and gradual even as the stages progress. Since the first and second trades use the same amount, the early-stage burden is relatively low. The third and fourth stages are also smaller compared to the Paroli strategy. Although the amounts continue to grow during longer winning streaks, the increase remains more moderate than simple doubling. The cycle completion rule must also be clearly defined. If the target is a 2-win streak, the cycle ends after the second successful trade. If the target is a 3-win streak, it ends after the third successful trade.
However, there are trade-offs as well. Because the growth pace is slower, the maximum potential profit during extended winning streaks may be lower than with the Paroli strategy. In other words, the Fibonacci strategy focuses more on balancing profit growth and psychological pressure rather than maximizing profits aggressively.
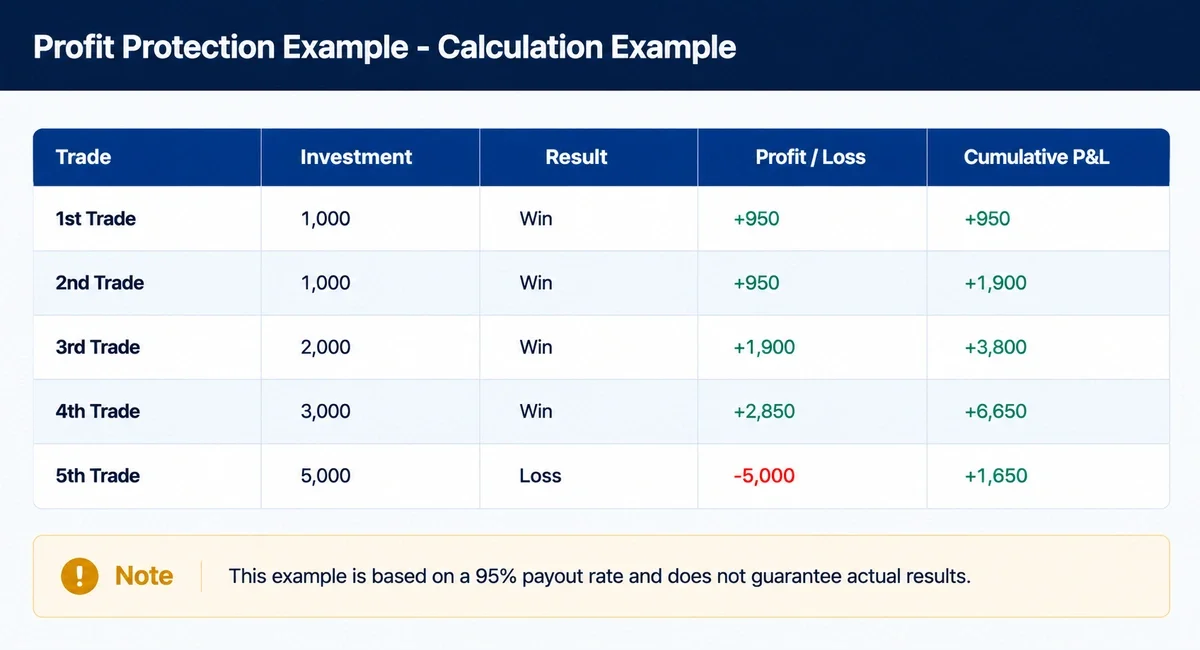
With a base amount of 1,000 and a 95% payout rate, achieving four consecutive wins using the sequence:
1,000 → 1,000 → 2,000 → 3,000
would result in a cumulative profit of +6,650.
If the next stage of 5,000 ends in a loss, then -5,000 is deducted, leaving a final cumulative profit of +1,650.
This example clearly demonstrates one of the key advantages of the Fibonacci strategy. Even though profits are scaled during a winning streak, a single loss afterward does not completely erase all accumulated gains. If the position sizes had increased more aggressively — as in the Paroli strategy — the impact of the final loss could have been much larger in the same scenario.
For this reason, the Fibonacci strategy is often described as a “moderate scaling structure that can still preserve part of the profits after a winning streak.” Of course, this example assumes a specific sequence of wins and losses, and actual results will vary depending on the length of the streak and the timing of losses.
The Fibonacci strategy feels very different depending on how many consecutive wins occur before a loss happens. If a loss occurs at the 3,000 stage after three consecutive wins, profits may decrease significantly. If a loss occurs at the 5,000 stage after four consecutive wins, some profits may still remain, as shown in the previous example. If the sequence reaches the 8,000 stage after five consecutive wins, profit potential becomes larger, but the size of the next possible loss also increases.
This comparison is important when deciding the target length of a winning streak. Extending the sequence indefinitely is not always the best approach — traders must decide at which point profits should be secured. Although the Fibonacci strategy is more moderate than aggressive scaling systems, investment amounts will still become larger as the sequence continues.
For beginners, targeting 3 to 4 consecutive wins is easier to explain and more manageable during demo testing. Beyond 5 consecutive wins, traders should consider not only profit potential but also the psychological pressure and the possibility of giving back accumulated gains.
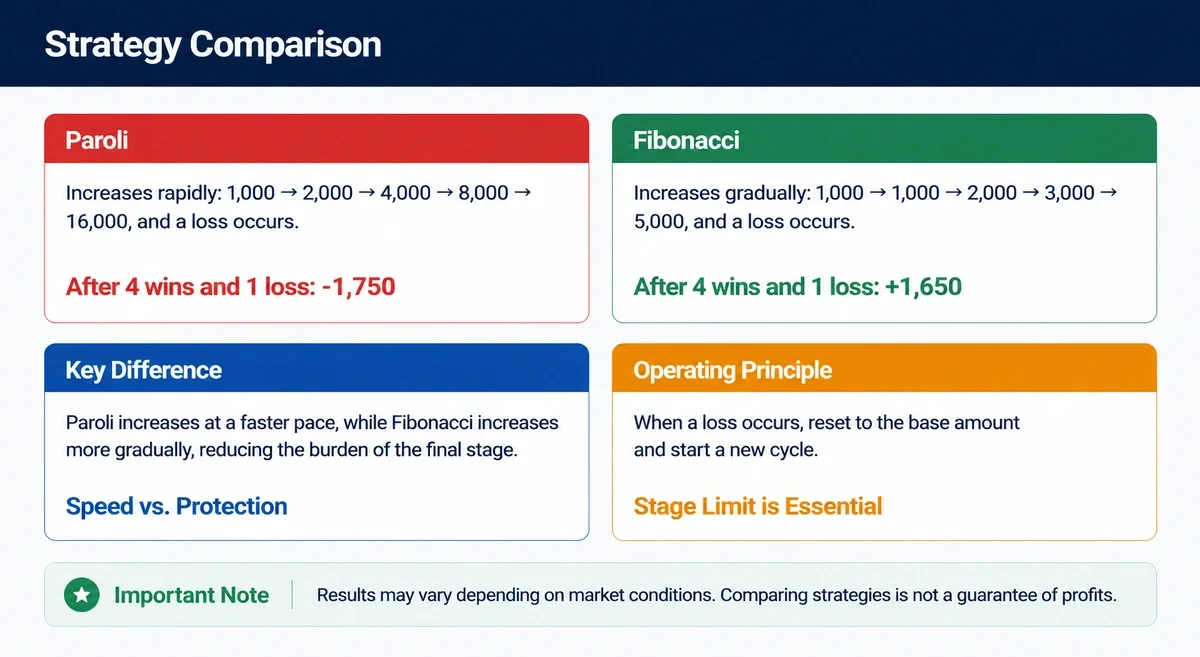
| Strategy | Trading Flow | Cumulative P&L After 4 Wins and 1 Loss |
| Paroli | 1,000 → 2,000 → 4,000 → 8,000 → Loss at 16,000 | -1,750 |
| Fibonacci | 1,000 → 1,000 → 2,000 → 3,000 → Loss at 5,000 | +1,650 |
Both the Paroli and Fibonacci strategies are post-win scaling systems. The key difference lies in the speed of growth. The Paroli strategy typically increases aggressively, such as:
1,000 → 2,000 → 4,000 → 8,000
whereas the Fibonacci strategy grows more gradually:
1,000 → 1,000 → 2,000 → 3,000 → 5,000
The difference becomes even clearer when assuming one loss after four consecutive wins. With the Paroli strategy, after winning through:
1,000 → 2,000 → 4,000 → 8,000
a loss at the 16,000 stage could result in a cumulative P&L of -1,750.
By contrast, with the Fibonacci strategy, even after a loss at the 5,000 stage, it is possible to maintain a cumulative profit of +1,650.
For this reason, the Paroli strategy is better suited for users who want to maximize winning streaks aggressively, while the Fibonacci strategy is more suitable for users who want to grow profits during winning streaks while reducing the impact of the final loss.
The Fibonacci strategy is particularly appealing to users who prefer gradual position scaling. It can feel like a strong alternative for traders who find the aggressive doubling structure of the Paroli strategy too stressful, yet still want to take more advantage of winning streaks than a fixed-amount trading approach allows.
The strategy also has advantages from a content and educational perspective. The numerical flow is easy to follow, and the contrast with the Paroli strategy is highly intuitive. Readers can quickly understand the difference between “aggressive expansion” and “gradual expansion” through charts, tables, and visual examples.
However, the Fibonacci strategy can still become burdensome if continued indefinitely. Although the sequence grows slowly, the investment amounts eventually become larger as the stages progress to 8, 13, 21, and beyond. For this reason, defining a target winning streak and setting a maximum stage limit are essential.
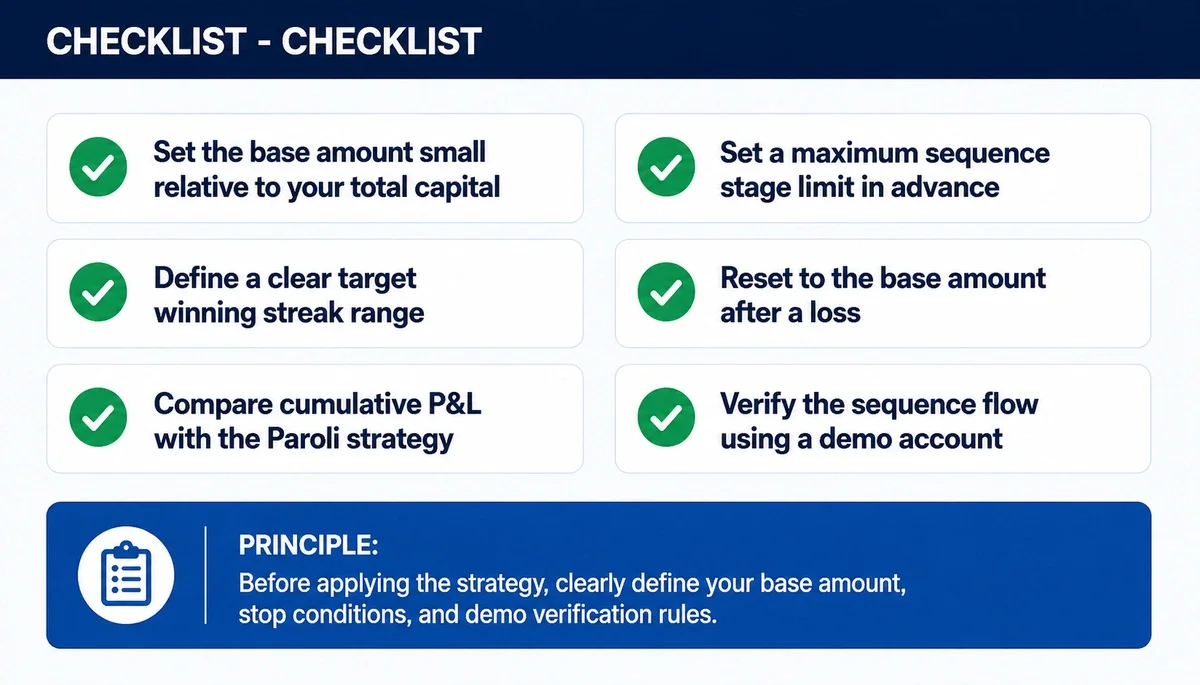
First, start with a small base amount.
Second, define a clear target winning streak, such as 3 or 4 consecutive wins.
Third, maintain the rule of resetting back to the base amount after a loss.
Fourth, once the maximum sequence stage is reached, end the cycle regardless of profit or loss.
Fifth, compare the strategy side-by-side with the Paroli approach through demo testing. By applying both strategies to the same entry signals and tracking cumulative P&L as well as profit giveback, the differences in their characteristics become much clearer.
The Fibonacci strategy is essentially a “slowly expanding winning-streak strategy.” Because of this, it fits especially well with content that emphasizes stability and smoother profit flow rather than aggressive profit maximization. For readers, presenting the strategy from the perspective of managing profit giveback rather than pursuing extreme returns tends to create greater trust and credibility.
The Fibonacci scaling strategy can be introduced as a strong alternative for users who feel uncomfortable with the rapid scaling speed of the Paroli strategy. Although both are post-win scaling systems, Fibonacci progresses more gradually, maintaining 1,000 at the second stage and then increasing slowly to 2,000, 3,000, and 5,000.
For example, in a Paroli structure with three consecutive wins, the third investment amount becomes 4,000, whereas in the Fibonacci strategy, the third investment amount is only 2,000. This difference feels significant in actual trading environments. While the pace of profit expansion becomes slower, the psychological burden of entering higher stages is also reduced.
For this reason, Fibonacci is well suited for users who want to take advantage of winning streaks without relying on overly aggressive scaling. Emphasizing the idea of protecting part of the accumulated profit after winning streaks — rather than chasing maximum profits — makes the strategy more persuasive and realistic.
The core message of the Fibonacci strategy is profit protection. It is easy to demonstrate a structure where profits are accumulated during winning streaks, while a single later loss still allows some cumulative profit to remain. Compared to strategies focused purely on maximizing returns, this approach often feels more practical and realistic to readers.
In particular, the example of one loss after four consecutive wins at a 95% payout rate is an extremely powerful explanation point. Unlike the Paroli strategy, the Fibonacci structure can still leave +1,650 in cumulative profit even after the final loss. This clearly illustrates the benefit of its gradual scaling speed.
However, profit protection is never guaranteed. If losses occur too early, the cycle may end before enough profit has been accumulated. Because of this, the Fibonacci strategy is most naturally explained in conditions where there is at least some probability of achieving winning streaks.
In the beginning, it is generally better not to exceed a target of four consecutive wins. Although the Fibonacci sequence grows gradually, investment amounts will eventually become large as the stages continue. Moving beyond 5,000 into 8,000 and 13,000 stages can create substantial pressure depending on account size.
During practical testing, it is highly recommended to compare the Fibonacci and Paroli strategies using the same entry signals. Recording total profits, cumulative P&L after the final loss, and psychological pressure side by side makes the differences between the two strategies much clearer.
When evaluating the Fibonacci strategy, it is often more meaningful to focus on the remaining profit after the final loss rather than the maximum profit achieved during a winning streak. This is because the true strength of the strategy lies more in profit protection than in aggressive profit expansion.
For example, comparing scenarios such as one loss after 3 consecutive wins, one loss after 4 consecutive wins, and one loss after 5 consecutive wins can help determine at which point the Fibonacci strategy feels the most stable. The differences become even clearer when compared side by side with the Paroli strategy under the same conditions.
Key data points to record include the investment flow, number of consecutive wins, position of the loss, cumulative P&L, and return relative to the base amount. By consistently collecting this data, traders can more easily determine whether the Fibonacci strategy matches their personal trading style.
In Fibonacci-related content, the most important message is that the strategy is “more gradual than Paroli.” Since readers usually already understand post-win scaling from the Paroli strategy, Fibonacci can naturally be introduced as an alternative approach.
The main selling points are:
Lower psychological pressure in the early stages
Smoother scaling speed
The ability to create scenarios where profits still remain even after one loss following a winning streak
Presenting these three points together through tables, examples, and visual explanations makes the strategy more engaging and easier to understand.
However, it is also important to explain that investment amounts will continue to grow as the Fibonacci sequence progresses. For this reason, the conclusion of the article should position Fibonacci as:
“A gradual post-win scaling strategy that still requires clear limits.”
To fully understand the Fibonacci Scaling Strategy, reading the explanation alone is not enough. It is important to repeatedly test the strategy under the same conditions using a demo account. By fixing the base amount, payout rate, target stage, and stop conditions, then recording at least 30 to 50 simulated trading sessions, the strengths and psychological burdens of the strategy become much clearer.
During testing, simply recording the final profit is not sufficient. Each trade should include:
Investment amount
Trade result
Net profit or loss
Cumulative P&L
Next stage or next decision criteria
This allows traders to identify not only whether the strategy generated profits, but also at which stages the psychological or financial burden became significant.
Since position sizing is the core element of the Fibonacci Scaling Strategy, it is also highly recommended to compare it directly with fixed-amount trading using the same entry signals. By analyzing whether the strategy produced greater profit expansion compared to fixed sizing — and how much pressure increased during losing periods — traders can establish clearer standards for selecting the most suitable strategy.
The first condition is the payout rate. If the payout rate is low, the final cumulative P&L can change significantly even with the same win rate and identical investment flow. For this reason, the payout rate should always be checked first when explaining or applying the strategy.
The second condition is the trading environment. In markets with excessive volatility or constantly changing direction, most money management strategies can perform poorly. It is important to clearly communicate to readers that entry conditions and market environments matter more than the strategy itself.
The third condition is the trader’s personality and risk tolerance. Even if the Fibonacci Scaling Strategy appears attractive numerically, it may not be suitable for users who struggle psychologically when investment amounts begin to grow in later stages. Therefore, the article should explain not only the strengths of the strategy, but also the type of trader it is best suited for.
The Fibonacci Scaling Strategy is not a formula that guarantees profits on its own. Rather, it is a money management approach that organizes how investment amounts are allocated. The strategy only becomes effective when combined with proper market direction analysis, trading timing, asset selection, and favorable payout conditions.
For blog content, the best approach is not to exaggerate the strategy, but to explain it using concrete numbers and realistic scenarios. Readers tend to stay engaged longer and understand the concept more easily when they can see how actual investment amounts and cumulative P&L change from a base amount of 1,000, rather than reading abstract descriptions.
The final recommendation is clear:
The Fibonacci Scaling Strategy is most meaningful when traders first verify the structure through demo testing, start with a small base amount, and operate strictly within predefined stop conditions.
Presenting the strategy in this way transforms the article from a simple strategy introduction into a complete SEO-focused trading strategy guide.
Q. What is the Fibonacci Scaling Strategy?
A. It is a strategy that increases investment amounts after wins according to the Fibonacci sequence and resets back to the base amount after a loss.
Q. Is it more stable than the Paroli strategy?
A. The scaling speed is more gradual, but it does not guarantee profits and still requires a maximum stage limit.
Q. How many consecutive wins should be targeted?
A. Beginners are generally recommended to start with a target of 3 to 4 consecutive wins and evaluate how much profit is given back after losses.
Q. What happens after a loss?
A. In most cases, the strategy resets to the base amount and begins a new cycle.
See How the Structure Can Still Preserve Profits Even After One Loss Following a Winning Streak
Set your base amount and payout rate in a demo account, then directly compare the actual investment flow of the Binary Options Fibonacci Scaling Strategy.
Next Article:
Complete Guide to the Binary Options 1-3-2-6 Strategy
Binary options and derivative trading involve the risk of losing principal and may not be suitable for all investors. The calculation examples in this article are assumptions designed to help explain the structure of the strategy. Actual results may vary depending on trading conditions, payout rates, execution environment, asset volatility, and the user’s entry criteria. This content is intended for general informational purposes only and does not guarantee specific profits or provide investment advice.