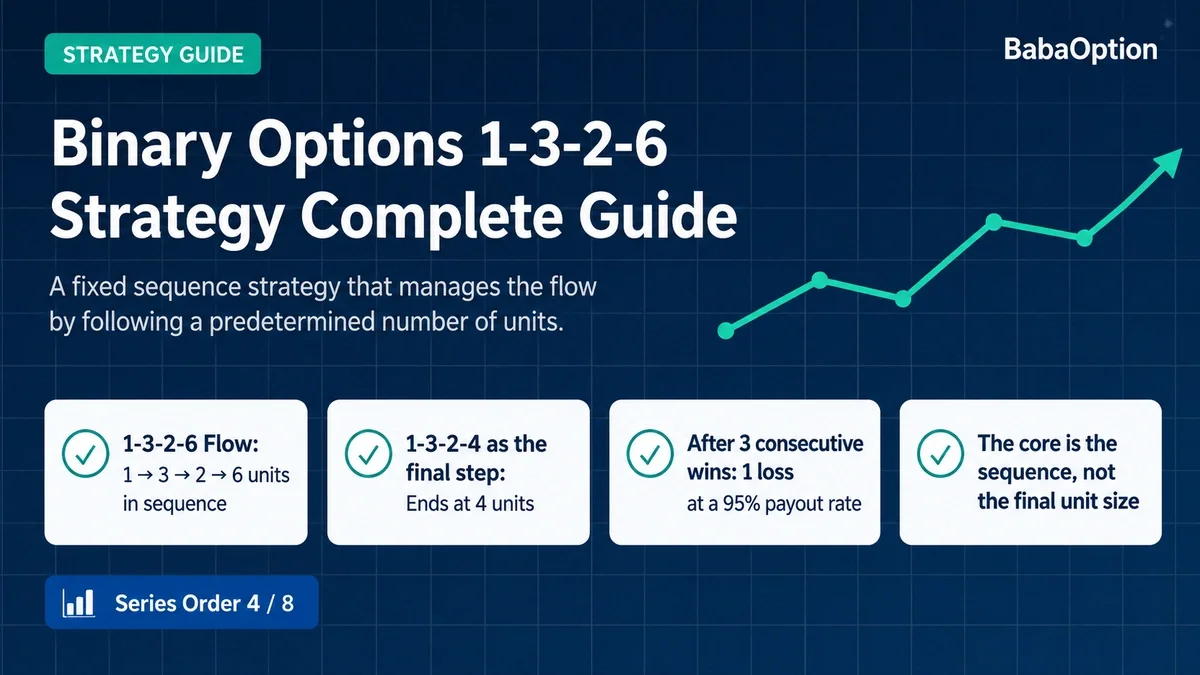
A fixed-sequence money management strategy that increases investment during winning flows using the
1 → 3 → 2 → 6 structure.
1. What Is the 1-3-2-6 Strategy?
2. Why Is It Called a Fixed-Sequence Strategy?
3. Basic 1-3-2-6 Operation Flow
4. Relationship Between the 1-3-2-6 and 1-3-2-4 Strategies
5. Example Based on a 95% Payout Rate
6. Why the Final Stage Matters
7. Differences from Paroli and Fibonacci Strategies
8. Who Is This Strategy Suitable For?
9. Practical Application Guidelines
10. Real Trading Scenario: Stop at Stage 3 or Continue to Stage 4?
11. Recommended User Profile for the 1-3-2-6 Strategy
12. Recommended Operation Summary
13. How to Verify the Strategy: Final-Stage Participation Rate
14. Key Points to Emphasize in Content
15. 1-3-2-6 Strategy Demo Testing Routine
16. Conditions to Check Before Applying the 1-3-2-6 Strategy
17. Final Recommended Position
18. Frequently Asked Questions
19. Risk Disclosure
The 1-3-2-6 strategy is a fixed-sequence money management method where the numbers themselves define the trading structure. The base amount is treated as 1 unit, and the investment amount changes according to the sequence:
1 → 3 → 2 → 6
For example, if the base amount is 1,000, the actual investment flow becomes:
1,000 → 3,000 → 2,000 → 6,000
In most cases, if a loss occurs at any stage, the cycle resets back to the base amount and starts again.
This strategy belongs to the same general category as post-win scaling strategies such as Paroli, because the investment amount increases only after a winning flow begins. However, it does not simply double the amount after each win. Instead, it increases from 1 to 3, then lowers to 2, and finally expands strongly at 6.
Because of this unique structure, the 1-3-2-6 strategy is best understood as a fixed-sequence strategy rather than a simple progressive betting system.
It is also important to compare it with the 1-3-2-4 strategy. Both strategies share the same first three stages, but the final stage is different. With a 95% payout rate, this final difference can significantly change the result, especially when a loss occurs after three consecutive wins.
In this guide, we will cover how the 1-3-2-6 strategy works, how it differs from 1-3-2-4, why the final stage is so important, and how traders can test the strategy in a demo account before considering real use.
The 1-3-2-6 strategy follows a fixed investment sequence of 1, 3, 2, and 6 units.
The 1-3-2-4 strategy is a more conservative variation with a smaller final stage.
With a 95% payout rate, if the fourth stage loses after three consecutive wins, 1-3-2-6 can turn the cycle into a small loss.
The most important decision is whether to enter the final stage or stop after the third successful trade.
The strategy is easy to record and compare, but it still depends heavily on winning streaks.
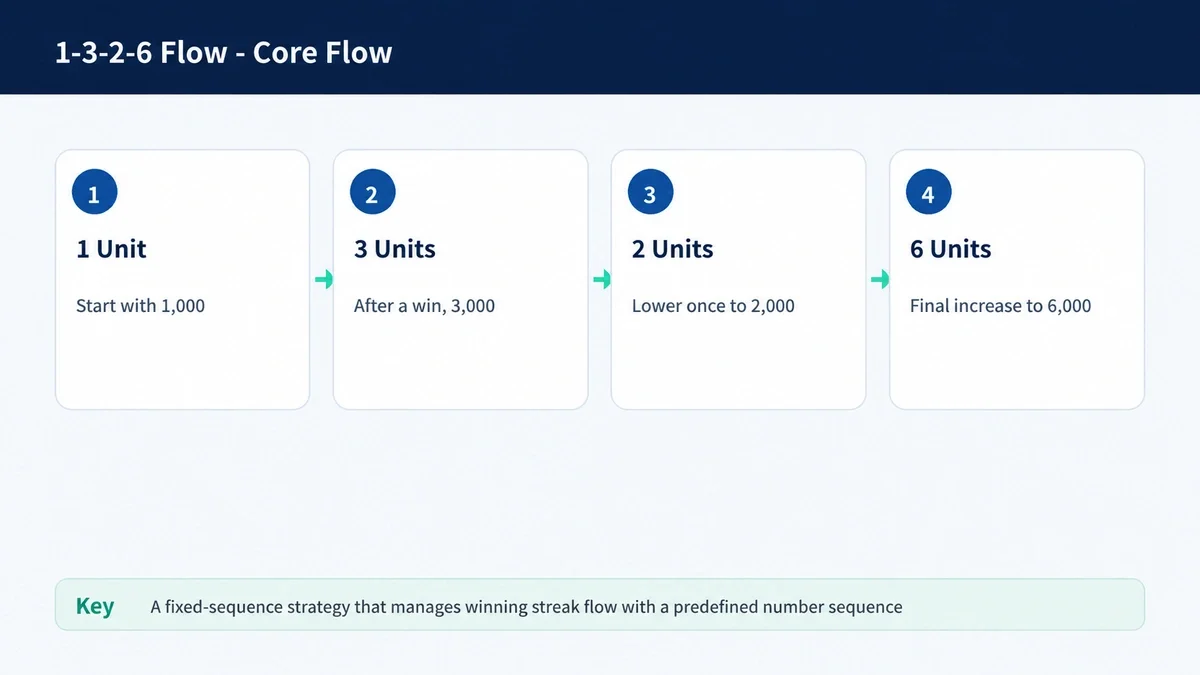
The 1-3-2-6 strategy is a money management method that uses a fixed investment sequence after wins. The base amount is defined as 1 unit, and each stage follows the preset order:
1 unit → 3 units → 2 units → 6 units
If the base amount is 1,000, the trade size becomes:
1,000 → 3,000 → 2,000 → 6,000
The most interesting part of this structure is that the investment amount does not increase in a straight line. After the first win, the second trade increases sharply to 3 units. After that, the third trade decreases to 2 units. Then the final stage increases strongly to 6 units.
This makes the strategy different from simple doubling systems. It includes both an expansion stage and a temporary reduction stage before the final high-risk, high-reward stage.
The strategy is designed to take advantage of short winning streaks. It can look attractive when entry signals are strong and there is a reasonable expectation of consecutive wins. However, in market conditions where wins and losses frequently alternate, the cycle may repeatedly reset back to the base amount.
The 1-3-2-6 strategy is called a fixed-sequence strategy because the investment order is already determined in advance. Traders do not need to calculate a new amount after every trade. They simply follow the sequence according to the current stage. This makes the strategy easy to understand and easy to record.
For example, if a trader is currently at stage 2, the next investment amount is already known. If the base amount is 1,000, stage 2 is 3,000. If stage 2 wins, stage 3 becomes 2,000. If stage 3 wins, stage 4 becomes 6,000.
This fixed structure makes it easier to compare the strategy with other money management methods such as Paroli, Fibonacci scaling, and fixed-amount trading.
However, the weakness of a fixed-sequence strategy is that it can become too mechanical if the trader does not define clear operating rules. The trader must decide in advance whether to complete all four stages, stop after three wins, or switch to a more conservative 1-3-2-4 structure at the final stage. Without these rules, the strategy becomes nothing more than following numbers without judgment.
The first trade begins with 1 unit. If it wins, the second trade moves to 3 units. If the second trade also wins, the third trade drops to 2 units. If the third trade wins, the final trade is placed at 6 units.
With a base amount of 1,000, the flow becomes:
1st trade: 1,000
2nd trade: 3,000
3rd trade: 2,000
4th trade: 6,000
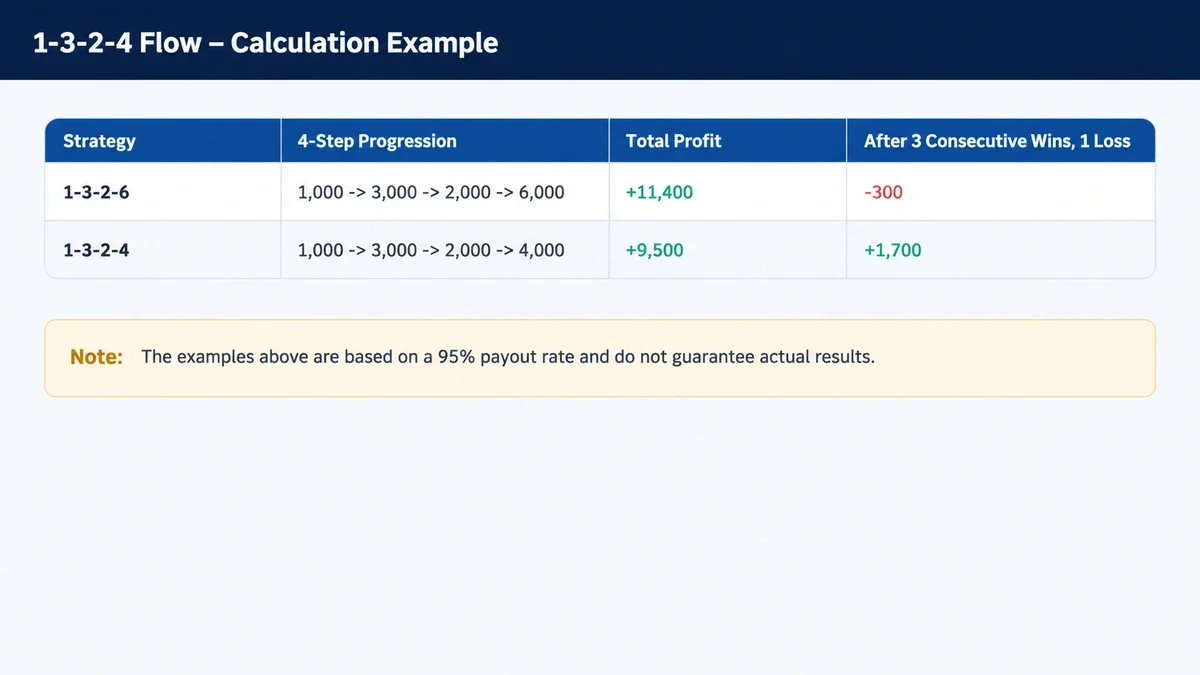
If all four trades win with a 95% payout rate, the cumulative profit becomes +11,400.
This is much higher than fixed-amount trading. If the trader used 1,000 for all four trades, four wins would produce only +3,800. This shows why the 1-3-2-6 strategy can appear powerful during winning streaks.
However, the fourth stage is also the most sensitive part of the strategy. Even if the first three trades win and create +5,700 in cumulative profit, a loss at the final 6,000 stage can turn the cycle into -300.
For this reason, the final stage should never be treated casually. The strategy’s result depends heavily on whether the trader enters the fourth stage and whether that trade succeeds.
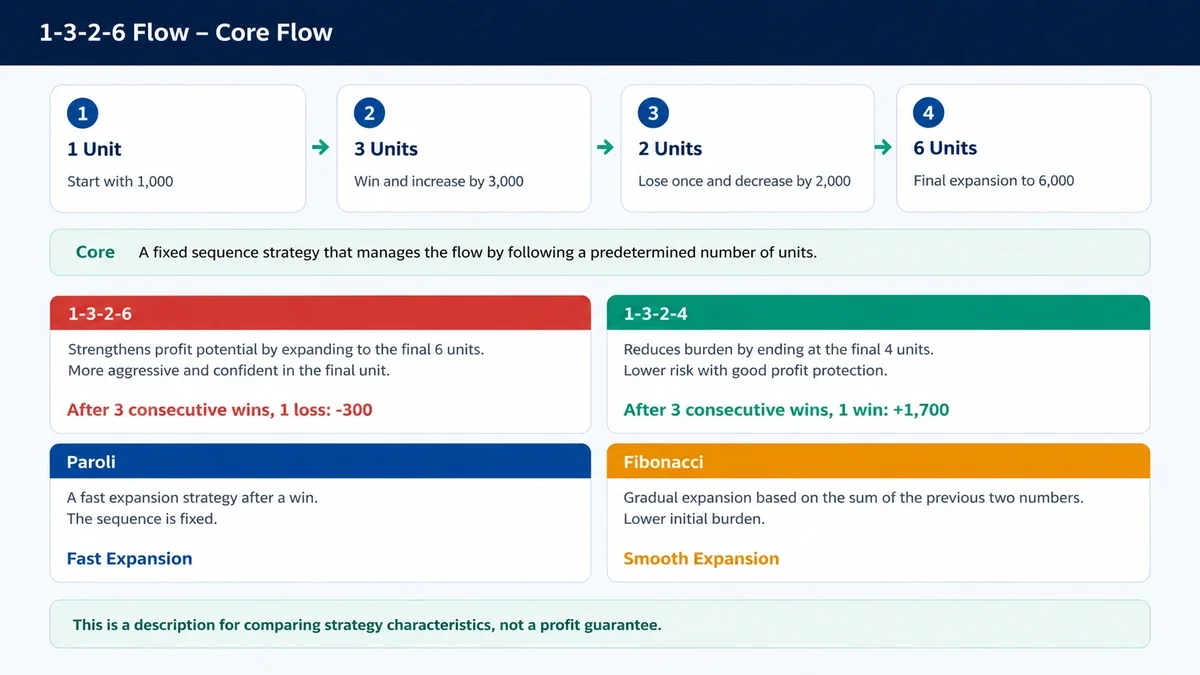
The 1-3-2-4 strategy shares the same early-stage flow as 1-3-2-6, but lowers the final stage to 4 units. If the base amount is 1,000, the flow becomes 1,000 → 3,000 → 2,000 → 4,000. While the maximum profit potential decreases, the burden of the final stage is also reduced.
The difference between the two strategies becomes most visible in the last stage. 1-3-2-6 can generate larger profits if stage 4 succeeds, but a final-stage loss can erase all profits from the previous three wins and even turn the cycle negative. In contrast, 1-3-2-4 has lower maximum profit potential but can still preserve gains even after a final-stage failure.
Therefore, 1-3-2-6 can be described as profit-expansion focused, while 1-3-2-4 is more profit-protection focused. Even within the same sequence structure, the intensity of the final stage changes the overall character of the strategy.
Assume the base amount is 1,000 and the payout rate is 95%.
If all four stages of the 1-3-2-6 strategy win, the result is:
| Trade | Investment Amount | Result | Net Profit/Loss | Cumulative P/L |
|---|---|---|---|---|
| 1st Trade | 1,000 | Win | +950 | +950 |
| 2nd Trade | 3,000 | Win | +2,850 | +3,800 |
| 3rd Trade | 2,000 | Win | +1,900 | +5,700 |
| 4th Trade | 6,000 | Win | +5,700 | +11,400 |
The final stage contributes a very large part of the total profit. This is why the 1-3-2-6 strategy can look highly attractive when all stages succeed.
However, if the first three trades win and the fourth trade loses, the result changes completely.
The trader has already made +5,700 after three wins. But the fourth trade loses 6,000. As a result, the final cumulative result becomes:
+5,700 - 6,000 = -300
This example shows why the final stage is the most important risk point in the 1-3-2-6 strategy.
By contrast, if the trader used the 1-3-2-4 strategy and lost at the final 4,000 stage after three wins, the result would still remain positive:
+5,700 - 4,000 = +1,700
This difference clearly shows the practical impact of choosing 6 units or 4 units at the final stage.
The final 6-unit stage is both the strongest profit opportunity and the largest risk point in the 1-3-2-6 strategy.
By the time a trader reaches the fourth stage, the first three trades have already created profit. The key question becomes:
Should the trader secure the profit now, or take one more trade to expand it further?
This is the most important decision in the strategy.
There are several possible ways to manage this stage.
One approach is the aggressive model. In this model, the trader always enters the fourth stage after three consecutive wins. If the final trade wins, the profit becomes much larger.
Another approach is the conservative model. In this model, the trader stops after the third successful trade and secures the accumulated profit.
A third approach is the hybrid model. The trader uses the 1-3-2-6 structure but only enters the fourth stage when market conditions remain stable, volatility is controlled, and the same directional signal is still valid.
This means the 1-3-2-6 strategy should not be explained as a system where traders must always complete all four stages. The better explanation is that the strategy requires a clear final-stage decision rule.
The 1-3-2-6 strategy is related to Paroli and Fibonacci scaling because all three strategies are based on increasing investment after wins. However, the way they increase investment is different.
The Paroli strategy usually grows aggressively, often using a doubling structure such as:
1 → 2 → 4
The Fibonacci scaling strategy grows more gradually using a sequence such as:
1 → 1 → 2 → 3 → 5
The 1-3-2-6 strategy follows its own fixed sequence:
1 → 3 → 2 → 6
This makes it unique. It does not simply double like Paroli, and it does not grow gradually like Fibonacci. Instead, it creates a strong second stage, lowers the third stage, and then expands sharply at the final stage.
For this reason, the 1-3-2-6 strategy works well as a follow-up topic after Paroli and Fibonacci. Once readers understand post-win scaling, they can more easily understand how fixed-sequence strategies create a different investment flow.
The 1-3-2-6 strategy may be suitable for traders who prefer clear numerical rules. Since the investment sequence is fixed, traders do not need to calculate a new amount each time. They only need to know the current stage.
It may also appeal to traders who want to take advantage of short winning streaks. If a trader’s entry method often produces two or three consecutive wins, the 1-3-2-6 strategy can be useful for testing how much additional profit can be created compared with fixed-amount trading.
However, this strategy is not suitable for everyone.
It may not be appropriate for traders who have difficulty stopping after reaching a target. It may also be risky for traders who try to recover immediately after a final-stage loss by switching to Martingale or increasing the amount even further.
The 1-3-2-6 strategy requires discipline. The sequence is simple, but the decision to stop is what makes the strategy manageable.
First, keep the base amount small. Since the final stage can become six times the base amount, the starting amount should be low enough to avoid unnecessary pressure.
Second, compare the 1-3-2-6 and 1-3-2-4 strategies under the same conditions in a demo account. This helps traders clearly see how the final stage changes the result.
Third, define the rule for stopping after stage 3 or continuing to stage 4. This rule should be decided before trading, not during the trading cycle.
Fourth, do not immediately switch to a loss-recovery strategy after a final-stage loss. The 1-3-2-6 strategy is a fixed-sequence strategy, not a Martingale recovery system.
Fifth, record every cycle. The record should include the base amount, stage, trade result, cumulative profit/loss, and whether the final stage was entered.
Without records, it is difficult to know whether the strategy is actually effective or only feels effective during winning streaks.
The most important practical decision in the 1-3-2-6 strategy is whether to stop after three successful trades or continue to the final stage.
After three wins, the trader already has accumulated profit. With a 95% payout rate and a base amount of 1,000, the cumulative profit after the first three stages is +5,700.
At this point, there are two main options.
The aggressive option is to continue to the fourth stage with 6,000. If this trade wins, the total profit becomes +11,400.
The conservative option is to stop after stage 3 and secure +5,700.
Another conservative variation is to switch the final stage from 6 units to 4 units. This creates the 1-3-2-4 structure, which reduces the impact of a final-stage loss.
For beginners, it is often more practical to compare these models through demo testing:
3-stage exit
4-stage 1-3-2-6 completion
4-stage 1-3-2-4 variation
By comparing these three models, traders can better understand whether they are more suited to profit expansion or profit protection.
The 1-3-2-6 strategy is suitable for users who want a clear and structured money management rule.
It may be attractive to traders who do not want to use loss-chasing systems like Martingale but still want to increase investment size during winning flows.
It is also useful for traders who want to compare aggressive and conservative sequence models. The direct comparison between 1-3-2-6 and 1-3-2-4 makes it easier to choose the version that matches their risk tolerance.
The aggressive trader may prefer 1-3-2-6 because the final stage offers stronger profit expansion.
The conservative trader may prefer 1-3-2-4 or a 3-stage exit model because these approaches reduce the chance of giving back accumulated profit.
Therefore, the 1-3-2-6 strategy should not be recommended as a universal solution. It should be presented as one option among fixed-sequence money management strategies.
A practical first test is to use a base amount of 1,000 and compare 1-3-2-6 with 1-3-2-4 under the same payout rate and entry conditions.
This makes the difference between the two strategies easy to understand.
The second recommendation is to define the final-stage entry condition. For example, a trader may decide to enter stage 4 only when the same directional signal remains valid after the third win.
The third recommendation is to reset after any loss. Once a loss occurs, the cycle should return to the base amount. If the trader increases the amount after a loss, the structure changes into a different strategy.
A simple recommended test model is:
Base amount: 1,000
Payout rate: 95%
Sequence: 1 → 3 → 2 → 6
Comparison model: 1 → 3 → 2 → 4
Key rule: decide in advance whether to enter the final stage
This makes the strategy easier to understand, easier to record, and easier to evaluate.
When testing the 1-3-2-6 strategy, it is not enough to look only at the final profit or loss.
The most important data point is the final-stage participation rate.
This means checking how often the trader actually reached the fourth stage and how often the fourth stage was entered.
For example, during demo testing, the trader should record:
How many cycles ended at stage 1
How many cycles reached stage 2
How many cycles reached stage 3
How many cycles entered stage 4
How many final-stage trades won
How many final-stage trades lost
How often the trader stopped after stage 3
This information reveals the real behavior of the strategy.
If the final stage wins often enough, the 1-3-2-6 model may show strong profit expansion. However, if the final stage frequently fails, the strategy may give back too much accumulated profit.
This is why the final-stage participation rate should be recorded separately from the overall win rate.
The most attractive part of the 1-3-2-6 strategy is the number sequence itself.
Readers will naturally want to know why the strategy uses 1, 3, 2, and 6. Therefore, the article should show the investment flow early and explain how the numbers affect the final result.
The strongest content points are:
The rules are simple and easy to follow.
The strategy can strongly expand profits during winning streaks.
The 1-3-2-4 strategy provides a useful conservative comparison.
The final stage is the key decision point.
The strategy should be tested through demo records before real use.
The article should avoid presenting the strategy as a guaranteed profit method. A more trustworthy explanation is that 1-3-2-6 is a structured money management model that can help traders organize investment amounts during winning flows.
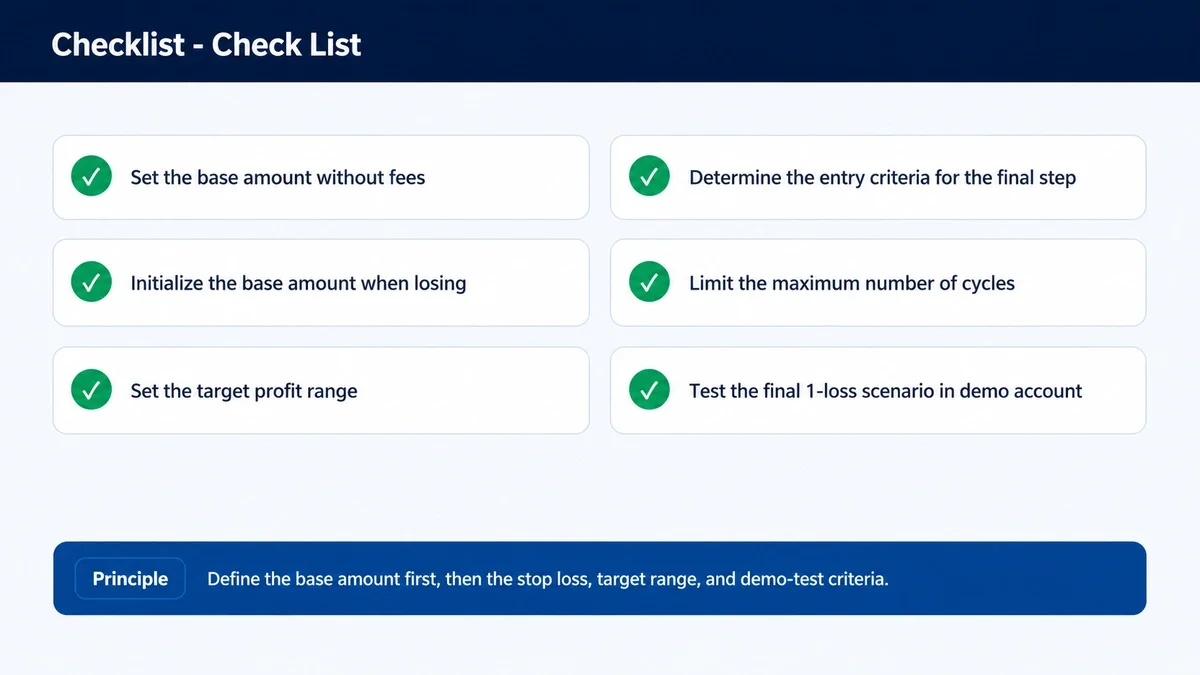
To understand the 1-3-2-6 strategy properly, traders should test it in a demo account before applying it to real trading.
The test should use fixed conditions:
Base amount
Payout rate
Maximum stage
Final-stage entry rule
Stop rule after loss
Daily cycle limit
It is recommended to record at least 30 to 50 simulated trade flows.
During testing, traders should not record only the final result. Each trade should include:
Investment amount
Trade result
Net profit/loss
Cumulative profit/loss
Current stage
Next-stage decision
This makes it possible to identify not only whether the strategy created profit, but also where the pressure increased.
It is also useful to compare the same entries with fixed-amount trading. This shows whether the 1-3-2-6 strategy actually improved profit performance or simply created larger fluctuations.
The first condition is the payout rate. If the payout rate is low, the final result can change significantly even with the same win/loss sequence.
The second condition is the trading environment. If the market direction changes frequently or volatility is unstable, any winning-streak strategy can become less effective.
The third condition is the trader’s personality. Even if the strategy looks attractive numerically, it may not be suitable for traders who feel strong pressure when the investment amount increases.
The fourth condition is the ability to stop. The strategy only remains manageable when the trader follows the predefined cycle rules.
For this reason, the 1-3-2-6 strategy should always be explained together with clear limits, small base amounts, and demo testing.
The 1-3-2-6 strategy is not a formula that guarantees profit. It is a money management framework that organizes how investment amounts are allocated during winning flows.
Its strength appears when the trader can combine it with strong entry signals, proper timing, favorable payout conditions, and clear stop rules.
For blog content, the most effective approach is to explain the strategy with concrete numbers. Readers can understand the strategy much more easily when they see how the investment amount changes from a base amount of 1,000 and how the cumulative profit changes depending on the final-stage result.
The final recommendation is clear:
The 1-3-2-6 strategy is most meaningful when traders first verify the structure through demo testing, keep the base amount small, and decide in advance whether the final stage will be used.
Presented this way, the article becomes more than a simple strategy explanation. It becomes a complete SEO-focused guide that helps readers understand both the appeal and the risk of fixed-sequence money management.
Q. What is the 1-3-2-6 strategy?
A. It is a fixed-sequence money management strategy that uses the investment flow of 1, 3, 2, and 6 units during winning sequences.
Q. How is it different from the 1-3-2-4 strategy?
A. The first three stages are the same, but the final stage is different. The 1-3-2-6 strategy uses 6 units at the final stage, while 1-3-2-4 uses 4 units.
Q. Does the final stage always need to be entered?
A. No. Traders can stop after the third successful trade or use the more conservative 1-3-2-4 version.
Q. Is the 1-3-2-6 strategy suitable for beginners?
A. The rules are easy to understand, but beginners should first test the strategy in a demo account because the final stage can create significant pressure.
Q. Is this strategy safer than Martingale?
A. It is different from Martingale because it does not increase investment after losses. However, it still carries risk because the investment amount becomes larger during winning sequences.
Set your base amount and payout rate in a demo account, then directly compare the actual investment flow of the Binary Options 1-3-2-6 Strategy with the more conservative 1-3-2-4 variation.
Next Article:
Complete Guide to the Binary Options D’Alembert Strategy
Binary options and derivative trading involve the risk of losing principal and may not be suitable for all investors. The calculation examples in this article are assumptions designed to help explain the structure of the strategy. Actual results may vary depending on trading conditions, payout rates, execution environment, asset volatility, and the user’s entry criteria. This content is intended for general informational purposes only and does not guarantee specific profits or provide investment advice.