A data-based money management method that calculates investment size using win rate and payout rate.
Index
1. What Is the Kelly Criterion?
2. Why Is It Useful in Binary Options?
3. Understanding the Formula and Variables
4. Required Win Rate with a 95% Payout Rate
5. Full, Half, and Quarter Kelly by Win Rate
6. Real Investment Examples with a 1,000,000 Account
7. Why Win Rate Estimation Errors Matter
8. How Is It Different from Stage-Based Strategies?
9. Practical Application Guidelines
10. Real Trading Scenario: How to Estimate Win Rate
11. Recommended User Profile for the Kelly Criterion
12. Recommended Operation Summary
13. How to Verify the Strategy: First Check the Break-Even Win Rate
14. Key Points to Emphasize in Content
15. Kelly Criterion Strategy Demo Testing Routine
16.Conditions to Check Before Applying the Kelly Criterion
17. Final Recommended Position
18. Frequently Asked Questions
19. Risk Disclosure
Complete Guide to the Binary Options Kelly Criterion Strategy: Calculating Investment Size with Win Rate and Payout Rate
The Kelly Criterion is different from strategies such as Martingale, Paroli, and Fibonacci. Those strategies adjust the next investment amount based on the result of previous trades. The Kelly Criterion calculates how much of the account should be invested before entering a trade, using the expected win rate and payout rate.
This makes the Kelly Criterion a data-based money management method rather than a stage-based sequence strategy.
Binary options are especially suitable for explaining the Kelly Criterion because the payout rate is usually known before the trade. If the payout rate is 95%, the break-even win rate is approximately 51.28%. If the trader cannot exceed this win rate, it is difficult to say that the trading condition has a long-term edge.
However, the most important part of the Kelly Criterion is not the calculation itself. It is the reliability of the data used in the calculation. If the estimated win rate is wrong, the calculated investment ratio can become too aggressive.
In this guide, we will cover the formula structure, how the Kelly ratio changes with a 95% payout rate, full Kelly, half Kelly, quarter Kelly, real investment examples with a 1,000,000 account, and why win rate estimation errors must be handled carefully.
The Kelly Criterion calculates the investment ratio using win rate and payout rate.
With a 95% payout rate, the break-even win rate is approximately 51.28%.
With a 55% win rate and a 95% payout rate, full Kelly is approximately 7.63%.
In practical use, half Kelly or quarter Kelly is often more realistic than full Kelly.
The Kelly Criterion is not a profit guarantee. It is a tool for calculating position size when a verified edge exists.
1. What Is the Kelly Criterion?
The Kelly Criterion is a money management formula that calculates what percentage of an account should be invested when a trader has a statistical edge.
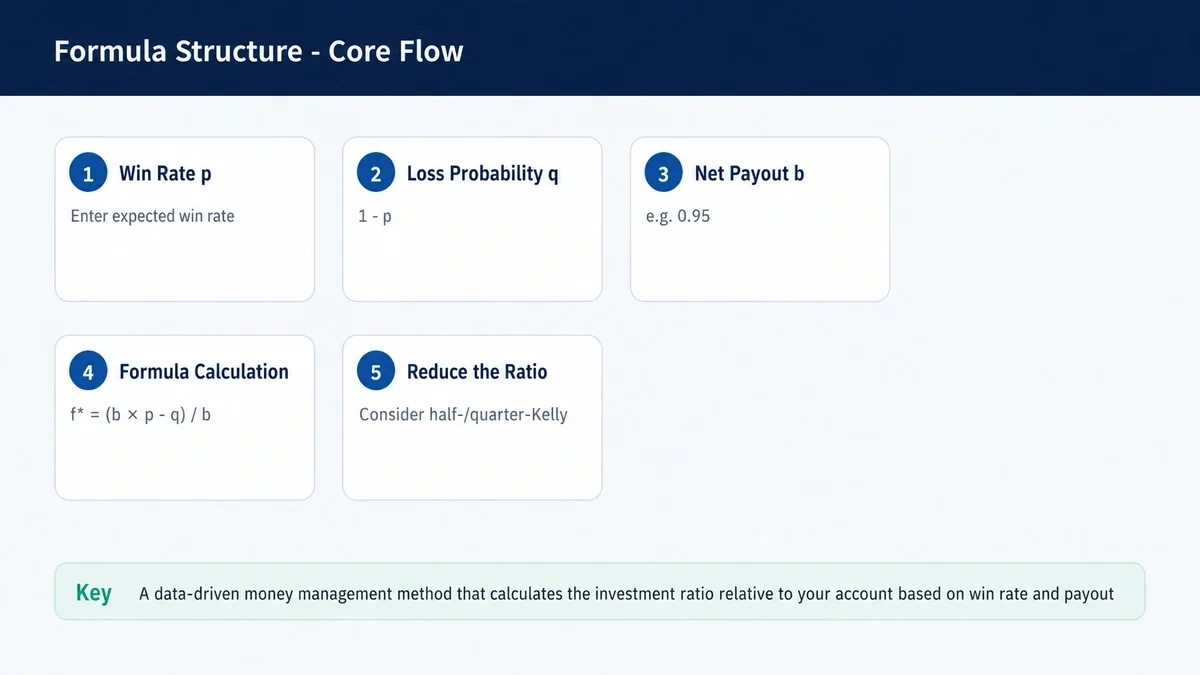
In binary options, the formula can be expressed using three variables:

p = expected win rate
q = losing probability
b = net payout rate

The formula is:

f* = (b × p - q) / b
Here, f* represents the suggested investment ratio relative to the total account balance.
If the payout rate is 95%, then b is 0.95.
If the expected win rate is 55%, then p is 0.55 and q is 0.45.
The calculation becomes:
(0.95 × 0.55 - 0.45) / 0.95
The result is approximately 0.0763, or 7.63%.
This means that if the account balance is 1,000,000, the theoretical full Kelly investment amount is about 76,300.
However, this value is theoretical. In real trading, many traders reduce the ratio by using half Kelly, quarter Kelly, or a separate maximum investment cap.
2. Why Is It Useful in Binary Options?
Binary options have a relatively clear payout structure. Before entering a trade, traders can usually see how much they may earn if the trade wins and how much they may lose if the trade fails.
This makes it easier to calculate the break-even win rate and theoretical investment ratio.
The Kelly Criterion encourages traders to ask an important question before trading:
Does this condition actually have an edge?
For example, with a 95% payout rate, a 50% win rate is not enough. Since a winning trade earns only 95% of the investment amount as net profit, the trader needs a win rate above 50% just to break even.
This is one of the strongest educational points of the Kelly Criterion. It is not simply a formula for increasing investment size. It is also a filter that helps traders identify whether a trading condition is worth using.
In this sense, the Kelly Criterion is fundamentally different from strategies that focus only on how to adjust investment size after wins or losses.
3. Understanding the Formula and Variables
To understand the Kelly Criterion, three variables must be clearly defined.
The first variable is p, the expected win rate.
The second variable is q, the losing probability. Since every trade either wins or loses in a simplified binary outcome, q is calculated as:

q = 1 - p
The third variable is b, the net payout rate.
If the payout rate is 95%, then b is 0.95.
Using a 55% expected win rate and a 95% payout rate, the formula becomes:
(0.95 × 0.55 - 0.45) / 0.95
The result is approximately 7.63%.
This means the formula suggests investing about 7.63% of the account under those assumptions.
The key point is that the ratio changes quickly when the win rate changes. For example, with a 95% payout rate, a 52% win rate produces a much smaller Kelly ratio than a 60% win rate.
That is why win rate estimation is the most sensitive part of the formula.
4. Required Win Rate with a 95% Payout Rate
With a 95% payout rate, the break-even win rate is approximately 51.28%.
This means that winning only half of all trades is not enough. Because the payout is below 100%, a trader must win slightly more than half of the trades to reach break-even.
If the win rate is only slightly above break-even, the Kelly ratio will also be small.
For example, at a 52% win rate and a 95% payout rate, the full Kelly ratio is only about 1.47%. This is a signal that the edge is small, so the investment ratio should also remain small.
On the other hand, if a trader overestimates the win rate, the calculated Kelly ratio can become too large very quickly.
This is why the Kelly Criterion should not be explained as:
“High win rate means you can invest a lot.”
A more accurate explanation is:
“If a verified edge exists, the Kelly Criterion estimates how much of the account can be allocated based on that edge.”
The quality of the win rate data matters more than the formula itself.
5. Full, Half, and Quarter Kelly by Win Rate
Full Kelly means using the ratio directly calculated by the formula.
Half Kelly means using half of the calculated ratio.
Quarter Kelly means using one quarter of the calculated ratio.
In real trading, many traders prefer half Kelly or quarter Kelly because the estimated win rate may not be perfectly accurate. Reducing the ratio can help lower account volatility and psychological pressure.
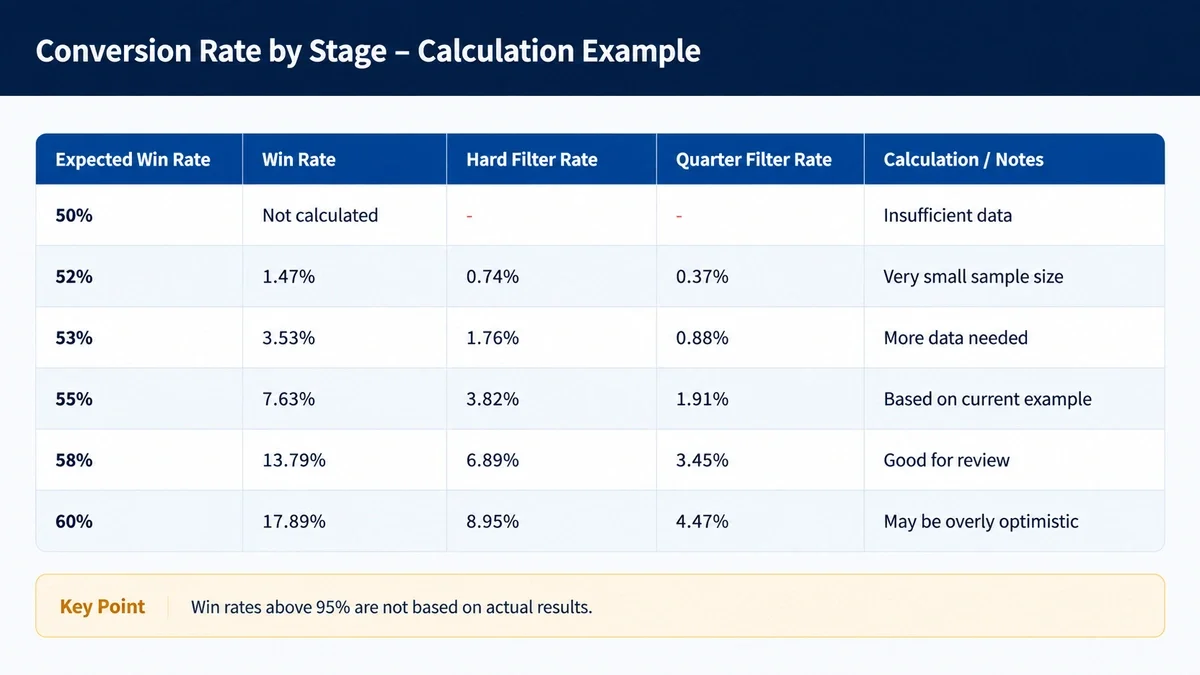
With a 95% payout rate:
| Expected Win Rate | Full Kelly | Half Kelly | Quarter Kelly | Interpretation |
|---|
| 50% | Avoid Trading | - | - | Insufficient expected value |
| 52% | 1.47% | 0.74% | 0.37% | Very small edge |
| 53% | 3.53% | 1.76% | 0.88% | Conservative approach needed |
| 55% | 7.63% | 3.82% | 1.91% | Main example condition |
| 58% | 13.79% | 6.89% | 3.45% | Win rate must be verified |
| 60% | 17.89% | 8.95% | 4.47% | Full Kelly can feel too aggressive |
This table shows how quickly the investment ratio increases as the win rate rises.
However, a higher ratio is not always better. If the estimated win rate is higher than the actual win rate, the trader may end up using an investment size that is too large for the real edge.
For this reason, conservative application is often more important than the exact theoretical result.
6. Real Investment Examples with a 1,000,000 Account
Assume the account balance is 1,000,000.
If the expected win rate is 55% and the payout rate is 95%, the full Kelly ratio is approximately 7.63%.
The investment amounts would be:
Full Kelly: about 76,300
Half Kelly: about 38,150
Quarter Kelly: about 19,075
Even under the same win rate and payout rate, the actual investment amount changes significantly depending on whether full, half, or quarter Kelly is used.
Full Kelly focuses on theoretical long-term growth, but it can create large account fluctuations.
Half Kelly and quarter Kelly reduce the growth speed, but they can also reduce psychological burden and account volatility.
For practical use, it is often more realistic to start with quarter Kelly or an even lower maximum cap. Even after enough trading data is collected, it may still be wise to set a separate rule that prevents any single trade from exceeding a fixed percentage of the account.
This helps prevent the formula from producing overly aggressive position sizes when the win rate estimate is uncertain.
7. Why Win Rate Estimation Errors Matter
The most dangerous part of the Kelly Criterion is win rate estimation.
Winning 6 out of the last 10 trades does not necessarily mean the true win rate is 60%. A small sample size can be heavily affected by randomness.
If the estimated win rate is wrong, the investment ratio will also be wrong.
For example, if the true win rate is 52% but the trader estimates it as 58%, the calculated full Kelly ratio becomes much larger than it should be. This can lead to excessive investment size and large account swings during losing streaks.
For this reason, the Kelly Criterion should be based on a sufficient number of recorded trades.
A practical approach is to calculate win rate using at least 50, 100, or 200 trades. It is also important to separate the data by trading condition.
For example:

specific asset,
specific time window,
specific signal type,
specific market condition.
If all trade results are mixed together, the win rate may not accurately represent the edge of the strategy being used.
The Kelly Criterion becomes much more meaningful when the input data is reliable.
8. How Is It Different from Stage-Based Strategies?
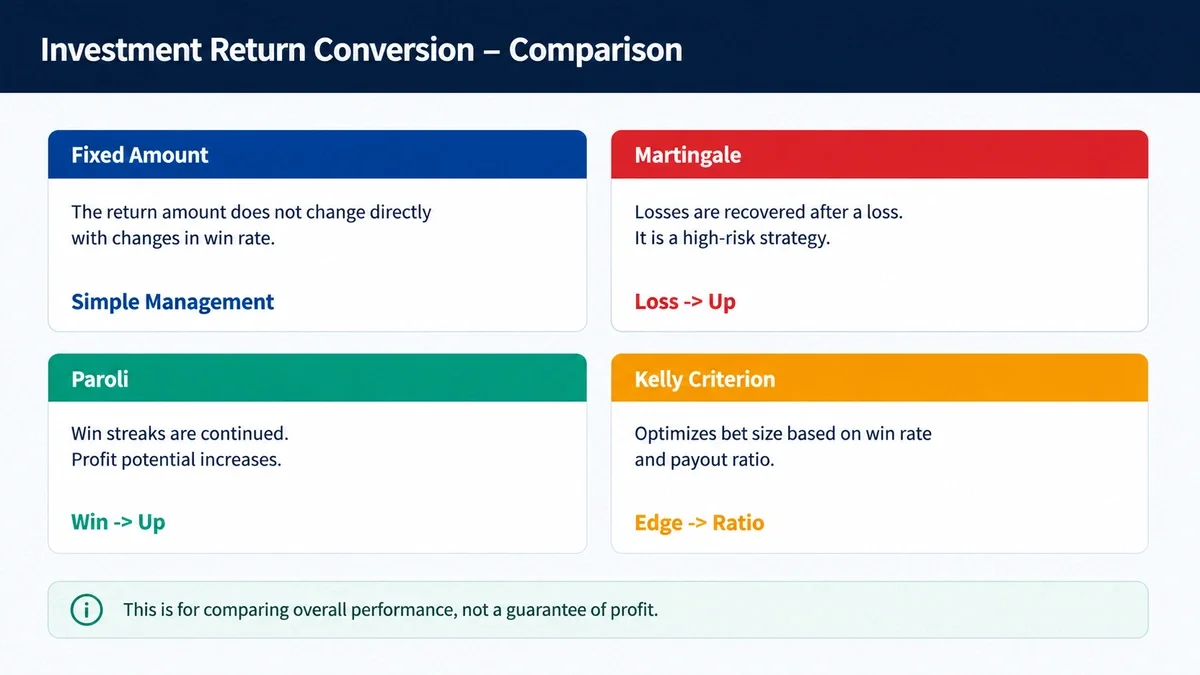
Strategies such as Martingale, Paroli, Fibonacci, and 1-3-2-6 adjust investment amounts based on the result flow of previous trades.
Martingale increases after losses.
Paroli increases after wins.
Fibonacci increases gradually after wins.
1-3-2-6 follows a fixed sequence.
The Kelly Criterion is different. It does not ask what happened in the previous trade. Instead, it asks:
Does this trading condition have a statistical edge?
If there is an edge, what percentage of the account should be used?
This makes the Kelly Criterion a pre-trade allocation method rather than a post-result sequence strategy.
For a strategy content series, Kelly works well as a final or advanced article. Earlier articles may explain how investment amounts change after wins and losses, while the Kelly article explains how to calculate position size using win rate and payout data.
This gives the series a more data-driven conclusion.
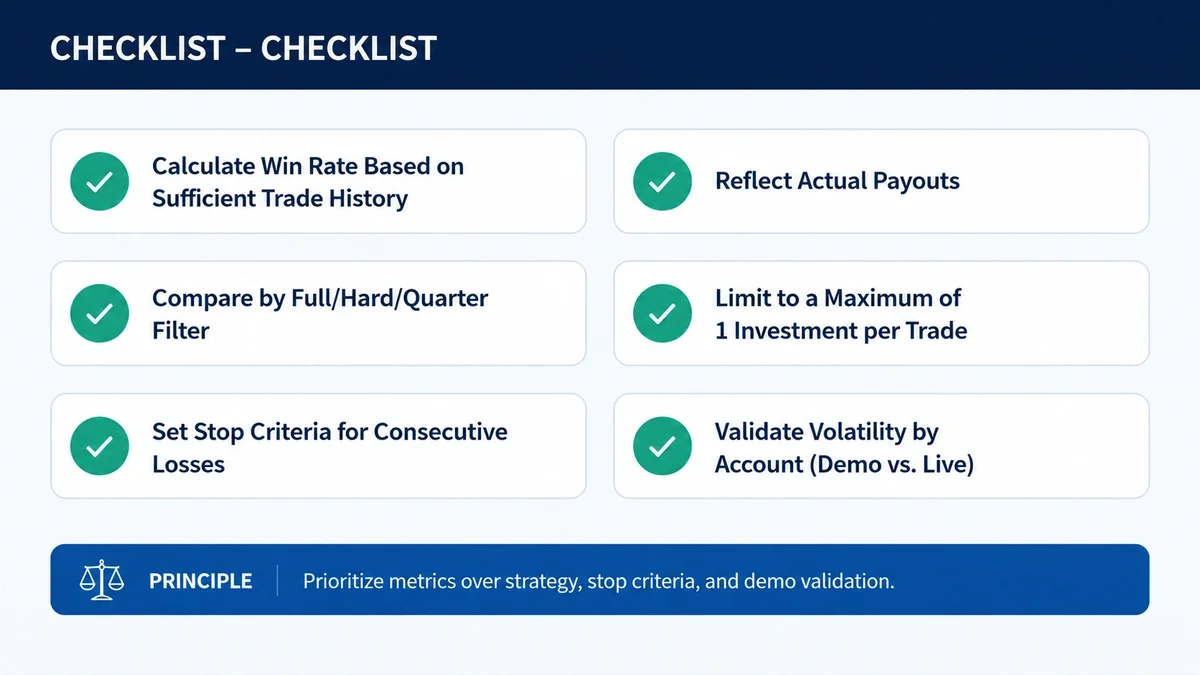
9. Practical Application Guidelines
The first step is to calculate the win rate using enough trade records.
The second step is to apply the actual payout rate, not an assumed payout rate.
The third step is to compare full Kelly, half Kelly, and quarter Kelly.
The fourth step is to define a maximum investment cap per trade.
The fifth step is to define a stop rule for consecutive losses.
The sixth step is to avoid trading if the win rate is below or too close to the break-even level.
The Kelly Criterion should not be used only as a tool for increasing investment size. It can also be used as a filter for avoiding trades with insufficient edge.
If the calculated ratio is zero or negative, the conclusion should not be “trade smaller.” The conclusion should usually be “do not trade under this condition.”
Finally, the Kelly ratio should be updated regularly. If the win rate or payout rate changes, the investment ratio also changes.
This makes the Kelly Criterion a dynamic money management tool rather than a fixed investment rule.
10. Real Trading Scenario: How to Estimate Win Rate
The most important input in the Kelly Criterion is the win rate.
However, win rate should not be estimated by feeling or short-term memory. The result of the last 10 trades is usually not enough because it can be strongly affected by randomness.
A better approach is to use at least 50 or 100 recorded trades.
For example, if a trader won 55 out of the last 100 trades, the win rate is 55%.
However, the trader should also ask where that 55% came from.
Was it from one asset or several assets?
Was it from one trading session or the entire day?
Was it from one clear signal or multiple mixed signals?
A combined win rate may not accurately represent the edge of a specific strategy.
For this reason, the Kelly Criterion should be used more like a record-analysis tool than a simple calculator. Before entering the win rate and payout rate into the formula, traders should first check whether the win rate is based on trustworthy and consistent data.
11. Recommended User Profile for the Kelly Criterion
The Kelly Criterion may be suitable for users who want to decide investment size based on data.
It can be a useful alternative for traders who do not want to increase investment amounts emotionally after losses or wins.
It is also useful for traders who have tested multiple strategies and want to compare their actual win rates. While Martingale, Paroli, and Fibonacci focus on investment flow, the Kelly Criterion helps evaluate whether the entry condition itself has a measurable edge.
However, Kelly may not be suitable for users who do not have enough trading records.
It can also be risky for users who overestimate their win rate. Since the formula looks mathematical and precise, it may create a false sense of confidence. But if the input data is wrong, the output ratio will also be wrong.
The Kelly Criterion is only as reliable as the win rate and payout assumptions used in the calculation.
12. Recommended Operation Summary
For practical use, the first application should generally not be full Kelly.
Quarter Kelly or an even lower cap is often a more realistic starting point because win rate estimation is rarely perfect.
The second recommendation is to treat conditions near or below the break-even win rate as no-trade conditions. One of the most valuable uses of the Kelly Criterion is filtering out trades with insufficient edge.
The third recommendation is to use Kelly as an advanced article in a strategy series. Earlier strategies explain how investment amounts change after trade results. Kelly explains how to calculate investment size before the trade using win rate and payout rate.
A practical test model may look like this:
Account balance: 1,000,000
Payout rate: 95%
Verified win rate: 55%
Full Kelly: 7.63%
Quarter Kelly: 1.91%
Initial practical cap: 1% to 2% per trade
This keeps the strategy realistic and easier to test.
13. How to Verify the Strategy: First Check the Break-Even Win Rate
Before applying the Kelly Criterion, the trader should first check the break-even win rate.
With a 95% payout rate, the break-even win rate is approximately 51.28%.
If the strategy does not exceed this level, the trader should consider avoiding the trade rather than calculating a position size.
Even if the win rate is slightly above break-even, this does not mean that a large investment should be used. A small edge should naturally produce a small Kelly ratio.
This is one of the most important messages of the Kelly Criterion:
small edge, small allocation.
During verification, traders should separate overall win rate from condition-specific win rate.
If the edge appears only during a certain asset, time window, or signal type, the Kelly ratio should be calculated only for that condition.
This makes the calculation more accurate and prevents overestimating the true edge.
14. Key Points to Emphasize in Content
The Kelly Criterion article should feel like a data-based conclusion to the strategy series.
Previous articles may explain how investment amounts change after wins or losses. Kelly is different because it calculates the investment ratio before the trade.
The key points worth emphasizing are:
It checks the break-even win rate.
It uses win rate and payout rate together.
It can be adjusted using full, half, and quarter Kelly.
It helps filter out trades without enough edge.
It depends heavily on accurate win rate estimation.
The conclusion should clearly state that the Kelly Criterion is not a profit guarantee. It is a tool for calculating investment size when a verified statistical edge exists.
This message makes the article more professional and responsible.
15. Kelly Criterion Strategy Demo Testing Routine
To understand the Kelly Criterion properly, reading the formula is not enough. Traders should test it with repeated demo records under the same conditions.
Before testing, the following conditions should be fixed:
Entry rule
Asset
Trading session
Payout rate
Account balance
Maximum investment cap
Stop rule
It is recommended to record at least 50 to 100 trades before trusting the win rate estimate.
During testing, recording only the final profit is not enough. Each trade should include:
Investment amount
Trade result
Net profit/loss
Cumulative profit/loss
Current estimated win rate
Payout rate
Applied Kelly fraction
Reason for entry
Since the Kelly Criterion depends on win rate estimation, the record should show whether the assumed win rate is stable over time.
It is also useful to compare Kelly-based position sizing with fixed-amount trading using the same entry signals. This helps determine whether the Kelly approach actually improves risk allocation or simply increases account fluctuation.
16. Conditions to Check Before Applying Oscar’s Grind
The first condition is the payout rate. If the payout rate changes, the break-even win rate and Kelly ratio also change.
The second condition is the reliability of the win rate. The win rate should be based on enough recorded trades, not a short winning streak.
The third condition is the trading environment. Market conditions can change, and a win rate that worked in one environment may not continue in another.
The fourth condition is trader personality. Even if the formula produces a high ratio, the trader must be able to handle the resulting account volatility.
The fifth condition is a maximum cap. Even if the Kelly formula produces a large number, practical trading should usually include a separate upper limit per trade.
For this reason, the Kelly Criterion should always be explained together with conservative application, demo testing, sufficient data, and risk limits.
17. Final Recommended Position
The Kelly Criterion is not a formula that guarantees profit. It is a money management framework that calculates investment size based on win rate and payout rate.
Its biggest strength is that it forces traders to think about edge before thinking about investment size.
If the win rate does not exceed the break-even level, the formula naturally suggests that the trade may not be worth taking. If the win rate is only slightly above break-even, the calculated ratio remains small. If the win rate is higher, the ratio increases — but only if the data is reliable.
For blog content, the best approach is to explain the strategy through concrete numbers. Readers can understand the formula more easily when they see how a 55% win rate, a 95% payout rate, and a 1,000,000 account balance produce full, half, and quarter Kelly investment amounts.
The final recommendation is clear:
The Kelly Criterion should first be tested with reliable trade records, applied conservatively through half or quarter Kelly, and limited by a maximum investment cap.
Presented this way, the article becomes more than a formula explanation. It becomes a complete SEO-focused strategy guide that explains both the usefulness and the limitations of data-based money management.
Frequently Asked Questions
Q. What is the Kelly Criterion?
A. It is a money management formula that uses win rate and payout rate to calculate what percentage of the account should be invested.
Q. What win rate is needed with a 95% payout rate?
A. The break-even win rate is approximately 51.28%.
Q. Should full Kelly be used directly?
A. In practical trading, it is usually better to start with half Kelly, quarter Kelly, or an even lower cap because win rate estimation can be inaccurate.
Q. Is Kelly the same as Martingale?
A. No. Martingale increases investment after losses, while Kelly calculates the investment ratio before the trade using win rate and payout rate.
Q. What is the biggest risk of the Kelly Criterion?
A. The biggest risk is using an inaccurate win rate. If the win rate is overestimated, the calculated investment ratio can become too large.
Set your win rate and payout rate in a demo account, then directly compare the actual investment flow of the Binary Options Kelly Criterion Strategy.
Try It in Demo
Next Article:
Start from the Beginning: Complete Guide to the Binary Options Martingale Strategy
Risk Disclosure
Binary options and derivative trading involve the risk of losing principal and may not be suitable for all investors. The calculation examples in this article are assumptions designed to help explain the structure of the strategy. Actual results may vary depending on trading conditions, payout rates, execution environment, asset volatility, and the user’s entry criteria. This content is intended for general informational purposes only and does not guarantee specific profits or provide investment advice.
 Trade
Trade